Immigrants from Lebanon vs Immigrants from Philippines Householder Income Ages 25 - 44 years
COMPARE
Immigrants from Lebanon
Immigrants from Philippines
Householder Income Ages 25 - 44 years
Householder Income Ages 25 - 44 years Comparison
Immigrants from Lebanon
Immigrants from Philippines
$101,124
HOUSEHOLDER INCOME AGES 25 - 44 YEARS
97.4/ 100
METRIC RATING
102nd/ 347
METRIC RANK
$102,910
HOUSEHOLDER INCOME AGES 25 - 44 YEARS
99.0/ 100
METRIC RATING
84th/ 347
METRIC RANK
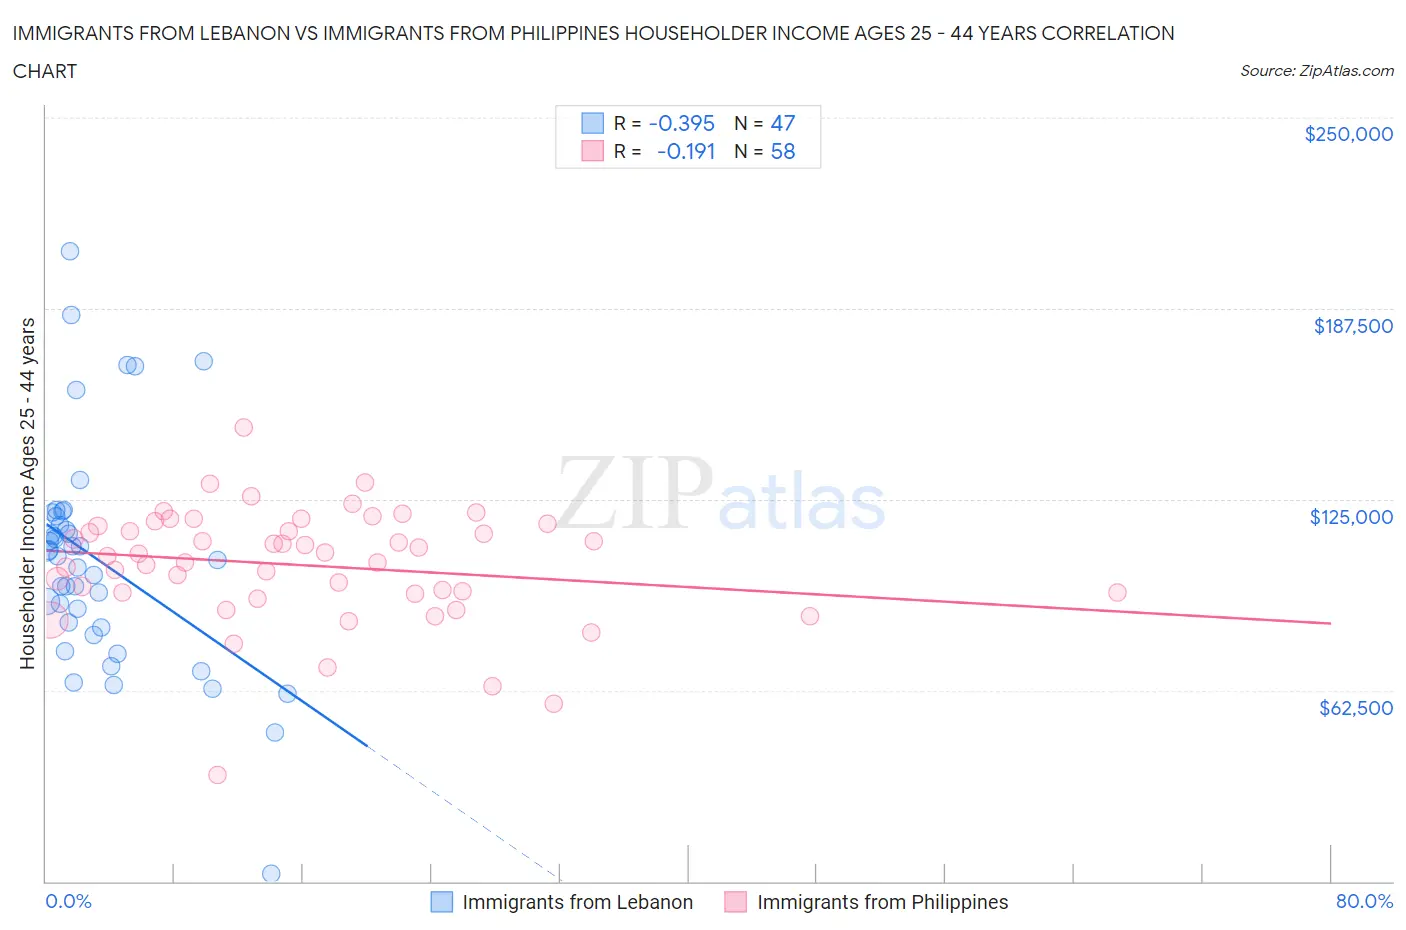
Immigrants from Lebanon vs Immigrants from Philippines Householder Income Ages 25 - 44 years Correlation Chart
The statistical analysis conducted on geographies consisting of 217,010,857 people shows a mild negative correlation between the proportion of Immigrants from Lebanon and household income with householder between the ages 25 and 44 in the United States with a correlation coefficient (R) of -0.395 and weighted average of $101,124. Similarly, the statistical analysis conducted on geographies consisting of 469,744,138 people shows a poor negative correlation between the proportion of Immigrants from Philippines and household income with householder between the ages 25 and 44 in the United States with a correlation coefficient (R) of -0.191 and weighted average of $102,910, a difference of 1.8%.
Householder Income Ages 25 - 44 years Correlation Summary
| Measurement | Immigrants from Lebanon | Immigrants from Philippines |
| Minimum | $2,499 | $34,643 |
| Maximum | $206,381 | $148,401 |
| Range | $203,882 | $113,758 |
| Mean | $105,094 | $103,402 |
| Median | $106,198 | $106,816 |
| Interquartile 25% (IQ1) | $82,875 | $94,583 |
| Interquartile 75% (IQ3) | $119,653 | $116,347 |
| Interquartile Range (IQR) | $36,778 | $21,764 |
| Standard Deviation (Sample) | $36,794 | $19,015 |
| Standard Deviation (Population) | $36,401 | $18,850 |
Demographics Similar to Immigrants from Lebanon and Immigrants from Philippines by Householder Income Ages 25 - 44 years
In terms of householder income ages 25 - 44 years, the demographic groups most similar to Immigrants from Lebanon are Immigrants from Moldova ($101,091, a difference of 0.030%), Albanian ($101,367, a difference of 0.24%), Immigrants from Argentina ($101,415, a difference of 0.29%), Taiwanese ($101,492, a difference of 0.36%), and Immigrants from Kazakhstan ($101,727, a difference of 0.60%). Similarly, the demographic groups most similar to Immigrants from Philippines are Argentinean ($103,111, a difference of 0.20%), Immigrants from Ukraine ($102,664, a difference of 0.24%), Immigrants from Hungary ($102,655, a difference of 0.25%), Immigrants from Western Europe ($102,654, a difference of 0.25%), and Immigrants from Canada ($102,616, a difference of 0.29%).
| Demographics | Rating | Rank | Householder Income Ages 25 - 44 years |
| Argentineans | 99.1 /100 | #83 | Exceptional $103,111 |
| Immigrants | Philippines | 99.0 /100 | #84 | Exceptional $102,910 |
| Immigrants | Ukraine | 98.9 /100 | #85 | Exceptional $102,664 |
| Immigrants | Hungary | 98.9 /100 | #86 | Exceptional $102,655 |
| Immigrants | Western Europe | 98.9 /100 | #87 | Exceptional $102,654 |
| Immigrants | Canada | 98.9 /100 | #88 | Exceptional $102,616 |
| Romanians | 98.8 /100 | #89 | Exceptional $102,544 |
| Ukrainians | 98.8 /100 | #90 | Exceptional $102,451 |
| Croatians | 98.7 /100 | #91 | Exceptional $102,414 |
| Immigrants | North America | 98.7 /100 | #92 | Exceptional $102,407 |
| Immigrants | England | 98.4 /100 | #93 | Exceptional $102,020 |
| Sri Lankans | 98.4 /100 | #94 | Exceptional $101,960 |
| Assyrians/Chaldeans/Syriacs | 98.3 /100 | #95 | Exceptional $101,936 |
| Macedonians | 98.3 /100 | #96 | Exceptional $101,882 |
| Austrians | 98.3 /100 | #97 | Exceptional $101,842 |
| Immigrants | Kazakhstan | 98.1 /100 | #98 | Exceptional $101,727 |
| Taiwanese | 97.9 /100 | #99 | Exceptional $101,492 |
| Immigrants | Argentina | 97.8 /100 | #100 | Exceptional $101,415 |
| Albanians | 97.8 /100 | #101 | Exceptional $101,367 |
| Immigrants | Lebanon | 97.4 /100 | #102 | Exceptional $101,124 |
| Immigrants | Moldova | 97.4 /100 | #103 | Exceptional $101,091 |