Immigrants from Latvia vs Potawatomi Female Disability
COMPARE
Immigrants from Latvia
Potawatomi
Female Disability
Female Disability Comparison
Immigrants from Latvia
Potawatomi
11.8%
FEMALE DISABILITY
95.6/ 100
METRIC RATING
128th/ 347
METRIC RANK
14.1%
FEMALE DISABILITY
0.0/ 100
METRIC RATING
321st/ 347
METRIC RANK
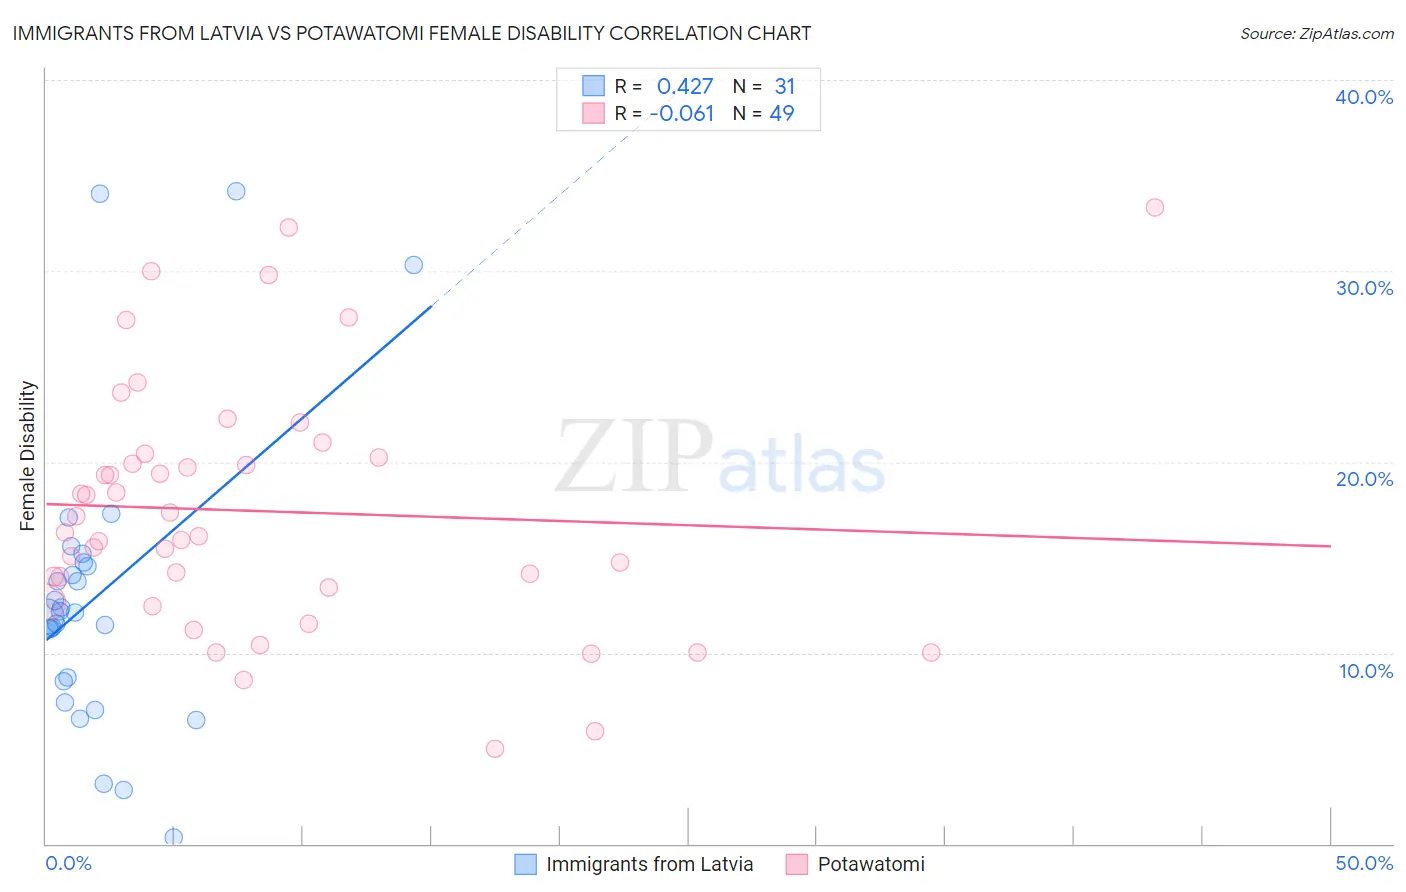
Immigrants from Latvia vs Potawatomi Female Disability Correlation Chart
The statistical analysis conducted on geographies consisting of 113,739,259 people shows a moderate positive correlation between the proportion of Immigrants from Latvia and percentage of females with a disability in the United States with a correlation coefficient (R) of 0.427 and weighted average of 11.8%. Similarly, the statistical analysis conducted on geographies consisting of 117,767,381 people shows a slight negative correlation between the proportion of Potawatomi and percentage of females with a disability in the United States with a correlation coefficient (R) of -0.061 and weighted average of 14.1%, a difference of 19.2%.
Female Disability Correlation Summary
| Measurement | Immigrants from Latvia | Potawatomi |
| Minimum | 0.34% | 5.0% |
| Maximum | 34.2% | 33.3% |
| Range | 33.8% | 28.3% |
| Mean | 13.0% | 17.4% |
| Median | 12.1% | 16.3% |
| Interquartile 25% (IQ1) | 8.5% | 13.0% |
| Interquartile 75% (IQ3) | 14.7% | 20.3% |
| Interquartile Range (IQR) | 6.2% | 7.3% |
| Standard Deviation (Sample) | 7.8% | 6.5% |
| Standard Deviation (Population) | 7.6% | 6.4% |
Similar Demographics by Female Disability
Demographics Similar to Immigrants from Latvia by Female Disability
In terms of female disability, the demographic groups most similar to Immigrants from Latvia are Macedonian (11.8%, a difference of 0.030%), South American Indian (11.8%, a difference of 0.040%), Nicaraguan (11.9%, a difference of 0.090%), Arab (11.9%, a difference of 0.12%), and Immigrants from Europe (11.8%, a difference of 0.14%).
| Demographics | Rating | Rank | Female Disability |
| Immigrants | Netherlands | 96.9 /100 | #121 | Exceptional 11.8% |
| Immigrants | North Macedonia | 96.8 /100 | #122 | Exceptional 11.8% |
| Immigrants | Croatia | 96.7 /100 | #123 | Exceptional 11.8% |
| Russians | 96.5 /100 | #124 | Exceptional 11.8% |
| Immigrants | Italy | 96.4 /100 | #125 | Exceptional 11.8% |
| Immigrants | Europe | 96.2 /100 | #126 | Exceptional 11.8% |
| South American Indians | 95.8 /100 | #127 | Exceptional 11.8% |
| Immigrants | Latvia | 95.6 /100 | #128 | Exceptional 11.8% |
| Macedonians | 95.5 /100 | #129 | Exceptional 11.8% |
| Nicaraguans | 95.2 /100 | #130 | Exceptional 11.9% |
| Arabs | 95.1 /100 | #131 | Exceptional 11.9% |
| Immigrants | Syria | 94.6 /100 | #132 | Exceptional 11.9% |
| Kenyans | 94.5 /100 | #133 | Exceptional 11.9% |
| Immigrants | Nicaragua | 94.5 /100 | #134 | Exceptional 11.9% |
| Central Americans | 94.2 /100 | #135 | Exceptional 11.9% |
Demographics Similar to Potawatomi by Female Disability
In terms of female disability, the demographic groups most similar to Potawatomi are Pueblo (14.1%, a difference of 0.010%), American (14.1%, a difference of 0.14%), Black/African American (14.1%, a difference of 0.18%), Native/Alaskan (14.1%, a difference of 0.20%), and Navajo (14.2%, a difference of 0.33%).
| Demographics | Rating | Rank | Female Disability |
| Puget Sound Salish | 0.0 /100 | #314 | Tragic 13.8% |
| Alaskan Athabascans | 0.0 /100 | #315 | Tragic 13.9% |
| Spanish Americans | 0.0 /100 | #316 | Tragic 14.0% |
| Chippewa | 0.0 /100 | #317 | Tragic 14.0% |
| Paiute | 0.0 /100 | #318 | Tragic 14.0% |
| Iroquois | 0.0 /100 | #319 | Tragic 14.0% |
| Americans | 0.0 /100 | #320 | Tragic 14.1% |
| Potawatomi | 0.0 /100 | #321 | Tragic 14.1% |
| Pueblo | 0.0 /100 | #322 | Tragic 14.1% |
| Blacks/African Americans | 0.0 /100 | #323 | Tragic 14.1% |
| Natives/Alaskans | 0.0 /100 | #324 | Tragic 14.1% |
| Navajo | 0.0 /100 | #325 | Tragic 14.2% |
| Comanche | 0.0 /100 | #326 | Tragic 14.2% |
| Ottawa | 0.0 /100 | #327 | Tragic 14.2% |
| Cape Verdeans | 0.0 /100 | #328 | Tragic 14.2% |