Immigrants from Latvia vs Nepalese Unemployment Among Ages 45 to 54 years
COMPARE
Immigrants from Latvia
Nepalese
Unemployment Among Ages 45 to 54 years
Unemployment Among Ages 45 to 54 years Comparison
Immigrants from Latvia
Nepalese
4.5%
UNEMPLOYMENT AMONG AGES 45 TO 54 YEARS
77.5/ 100
METRIC RATING
145th/ 347
METRIC RANK
5.0%
UNEMPLOYMENT AMONG AGES 45 TO 54 YEARS
0.0/ 100
METRIC RATING
279th/ 347
METRIC RANK
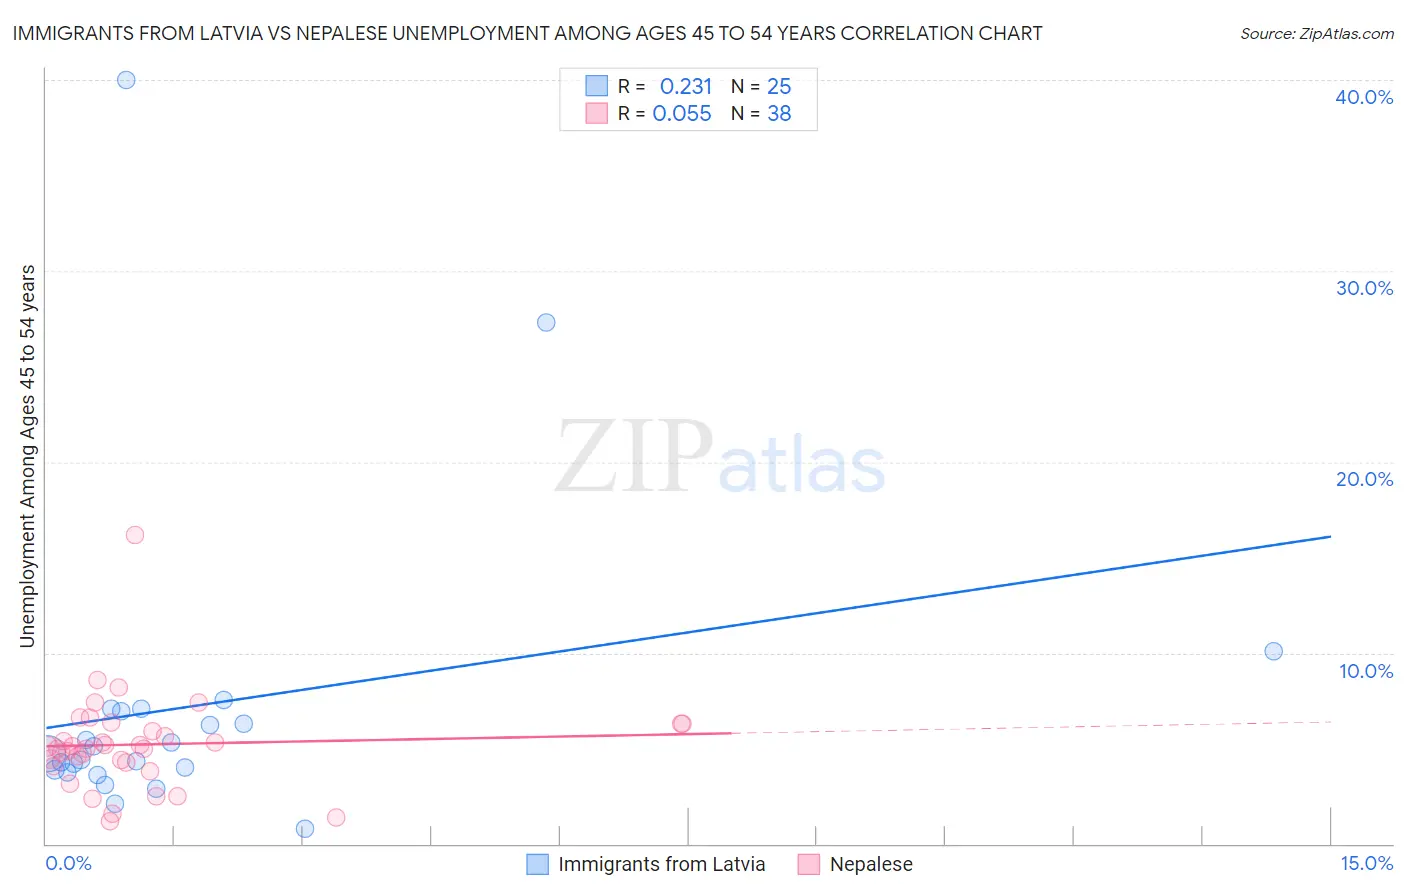
Immigrants from Latvia vs Nepalese Unemployment Among Ages 45 to 54 years Correlation Chart
The statistical analysis conducted on geographies consisting of 112,896,581 people shows a weak positive correlation between the proportion of Immigrants from Latvia and unemployment rate among population between the ages 45 and 54 in the United States with a correlation coefficient (R) of 0.231 and weighted average of 4.5%. Similarly, the statistical analysis conducted on geographies consisting of 24,455,119 people shows a slight positive correlation between the proportion of Nepalese and unemployment rate among population between the ages 45 and 54 in the United States with a correlation coefficient (R) of 0.055 and weighted average of 5.0%, a difference of 13.2%.
Unemployment Among Ages 45 to 54 years Correlation Summary
| Measurement | Immigrants from Latvia | Nepalese |
| Minimum | 0.80% | 1.2% |
| Maximum | 40.0% | 16.2% |
| Range | 39.2% | 15.0% |
| Mean | 7.2% | 5.2% |
| Median | 4.7% | 5.1% |
| Interquartile 25% (IQ1) | 3.8% | 4.3% |
| Interquartile 75% (IQ3) | 7.0% | 6.3% |
| Interquartile Range (IQR) | 3.2% | 2.0% |
| Standard Deviation (Sample) | 8.4% | 2.5% |
| Standard Deviation (Population) | 8.2% | 2.5% |
Similar Demographics by Unemployment Among Ages 45 to 54 years
Demographics Similar to Immigrants from Latvia by Unemployment Among Ages 45 to 54 years
In terms of unemployment among ages 45 to 54 years, the demographic groups most similar to Immigrants from Latvia are Syrian (4.5%, a difference of 0.010%), Taiwanese (4.5%, a difference of 0.030%), Uruguayan (4.5%, a difference of 0.040%), Macedonian (4.5%, a difference of 0.11%), and Immigrants from Netherlands (4.4%, a difference of 0.14%).
| Demographics | Rating | Rank | Unemployment Among Ages 45 to 54 years |
| Immigrants | Congo | 81.8 /100 | #138 | Excellent 4.4% |
| Immigrants | Kuwait | 81.7 /100 | #139 | Excellent 4.4% |
| Immigrants | Zaire | 80.7 /100 | #140 | Excellent 4.4% |
| Immigrants | Afghanistan | 79.6 /100 | #141 | Good 4.4% |
| Immigrants | Netherlands | 79.4 /100 | #142 | Good 4.4% |
| Macedonians | 79.0 /100 | #143 | Good 4.5% |
| Taiwanese | 77.9 /100 | #144 | Good 4.5% |
| Immigrants | Latvia | 77.5 /100 | #145 | Good 4.5% |
| Syrians | 77.3 /100 | #146 | Good 4.5% |
| Uruguayans | 76.9 /100 | #147 | Good 4.5% |
| Immigrants | Austria | 75.3 /100 | #148 | Good 4.5% |
| Costa Ricans | 75.3 /100 | #149 | Good 4.5% |
| Tsimshian | 74.6 /100 | #150 | Good 4.5% |
| Cypriots | 74.4 /100 | #151 | Good 4.5% |
| Koreans | 73.1 /100 | #152 | Good 4.5% |
Demographics Similar to Nepalese by Unemployment Among Ages 45 to 54 years
In terms of unemployment among ages 45 to 54 years, the demographic groups most similar to Nepalese are Dutch West Indian (5.0%, a difference of 0.14%), Blackfeet (5.1%, a difference of 0.21%), Spanish American Indian (5.1%, a difference of 0.29%), Immigrants from Mexico (5.0%, a difference of 0.34%), and African (5.1%, a difference of 0.44%).
| Demographics | Rating | Rank | Unemployment Among Ages 45 to 54 years |
| Immigrants | Central America | 0.0 /100 | #272 | Tragic 5.0% |
| Immigrants | Latin America | 0.0 /100 | #273 | Tragic 5.0% |
| U.S. Virgin Islanders | 0.0 /100 | #274 | Tragic 5.0% |
| Bermudans | 0.0 /100 | #275 | Tragic 5.0% |
| French American Indians | 0.0 /100 | #276 | Tragic 5.0% |
| Immigrants | Mexico | 0.0 /100 | #277 | Tragic 5.0% |
| Dutch West Indians | 0.0 /100 | #278 | Tragic 5.0% |
| Nepalese | 0.0 /100 | #279 | Tragic 5.0% |
| Blackfeet | 0.0 /100 | #280 | Tragic 5.1% |
| Spanish American Indians | 0.0 /100 | #281 | Tragic 5.1% |
| Africans | 0.0 /100 | #282 | Tragic 5.1% |
| Hispanics or Latinos | 0.0 /100 | #283 | Tragic 5.1% |
| Kiowa | 0.0 /100 | #284 | Tragic 5.1% |
| Iroquois | 0.0 /100 | #285 | Tragic 5.1% |
| Senegalese | 0.0 /100 | #286 | Tragic 5.1% |