Immigrants from Latvia vs Immigrants No Schooling Completed
COMPARE
Immigrants from Latvia
Immigrants
No Schooling Completed
No Schooling Completed Comparison
Immigrants from Latvia
Immigrants
1.9%
NO SCHOOLING COMPLETED
96.7/ 100
METRIC RATING
110th/ 347
METRIC RANK
2.8%
NO SCHOOLING COMPLETED
0.0/ 100
METRIC RATING
296th/ 347
METRIC RANK
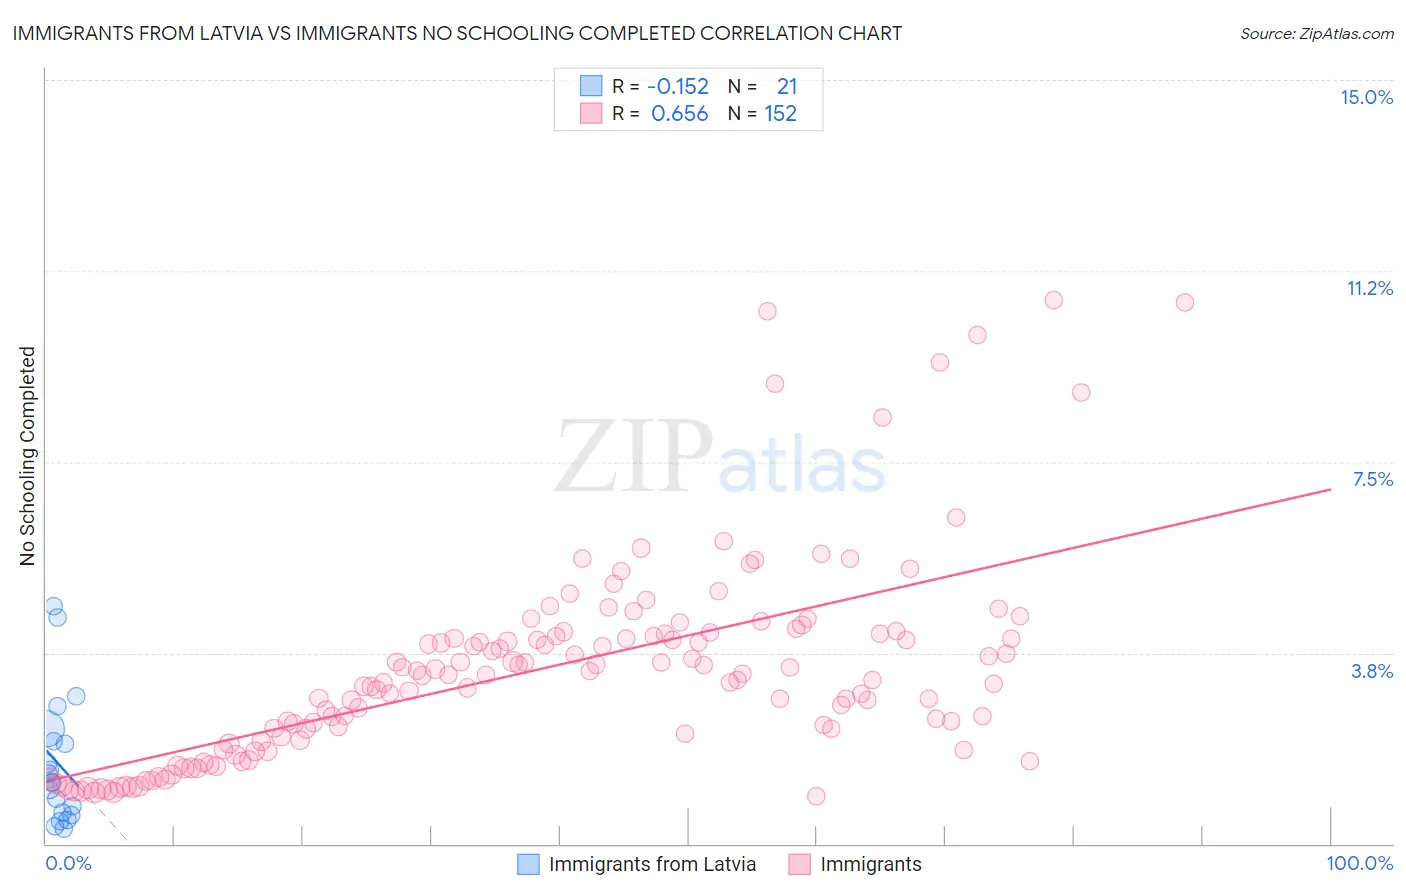
Immigrants from Latvia vs Immigrants No Schooling Completed Correlation Chart
The statistical analysis conducted on geographies consisting of 113,303,053 people shows a poor negative correlation between the proportion of Immigrants from Latvia and percentage of population with no schooling in the United States with a correlation coefficient (R) of -0.152 and weighted average of 1.9%. Similarly, the statistical analysis conducted on geographies consisting of 558,837,103 people shows a significant positive correlation between the proportion of Immigrants and percentage of population with no schooling in the United States with a correlation coefficient (R) of 0.656 and weighted average of 2.8%, a difference of 50.4%.
No Schooling Completed Correlation Summary
| Measurement | Immigrants from Latvia | Immigrants |
| Minimum | 0.30% | 0.93% |
| Maximum | 4.7% | 10.7% |
| Range | 4.4% | 9.8% |
| Mean | 1.6% | 3.4% |
| Median | 1.2% | 3.3% |
| Interquartile 25% (IQ1) | 0.59% | 2.0% |
| Interquartile 75% (IQ3) | 2.1% | 4.1% |
| Interquartile Range (IQR) | 1.5% | 2.1% |
| Standard Deviation (Sample) | 1.2% | 2.0% |
| Standard Deviation (Population) | 1.2% | 2.0% |
Similar Demographics by No Schooling Completed
Demographics Similar to Immigrants from Latvia by No Schooling Completed
In terms of no schooling completed, the demographic groups most similar to Immigrants from Latvia are Immigrants from Saudi Arabia (1.9%, a difference of 0.13%), Immigrants from Japan (1.9%, a difference of 0.15%), Pueblo (1.9%, a difference of 0.33%), Okinawan (1.8%, a difference of 0.48%), and Immigrants from Zimbabwe (1.9%, a difference of 0.58%).
| Demographics | Rating | Rank | No Schooling Completed |
| Basques | 97.9 /100 | #103 | Exceptional 1.8% |
| Thais | 97.5 /100 | #104 | Exceptional 1.8% |
| German Russians | 97.5 /100 | #105 | Exceptional 1.8% |
| Immigrants | France | 97.3 /100 | #106 | Exceptional 1.8% |
| Yugoslavians | 97.2 /100 | #107 | Exceptional 1.8% |
| Okinawans | 97.1 /100 | #108 | Exceptional 1.8% |
| Immigrants | Saudi Arabia | 96.8 /100 | #109 | Exceptional 1.9% |
| Immigrants | Latvia | 96.7 /100 | #110 | Exceptional 1.9% |
| Immigrants | Japan | 96.6 /100 | #111 | Exceptional 1.9% |
| Pueblo | 96.4 /100 | #112 | Exceptional 1.9% |
| Immigrants | Zimbabwe | 96.2 /100 | #113 | Exceptional 1.9% |
| Immigrants | Norway | 96.1 /100 | #114 | Exceptional 1.9% |
| Syrians | 96.0 /100 | #115 | Exceptional 1.9% |
| Lebanese | 96.0 /100 | #116 | Exceptional 1.9% |
| Immigrants | Serbia | 95.8 /100 | #117 | Exceptional 1.9% |
Demographics Similar to Immigrants by No Schooling Completed
In terms of no schooling completed, the demographic groups most similar to Immigrants are Houma (2.8%, a difference of 0.10%), Immigrants from Eritrea (2.8%, a difference of 0.62%), Malaysian (2.8%, a difference of 0.79%), Immigrants from Cuba (2.8%, a difference of 1.1%), and Immigrants from Grenada (2.8%, a difference of 1.2%).
| Demographics | Rating | Rank | No Schooling Completed |
| Immigrants | Thailand | 0.0 /100 | #289 | Tragic 2.7% |
| Immigrants | Hong Kong | 0.0 /100 | #290 | Tragic 2.7% |
| British West Indians | 0.0 /100 | #291 | Tragic 2.7% |
| Immigrants | Grenada | 0.0 /100 | #292 | Tragic 2.8% |
| Malaysians | 0.0 /100 | #293 | Tragic 2.8% |
| Immigrants | Eritrea | 0.0 /100 | #294 | Tragic 2.8% |
| Houma | 0.0 /100 | #295 | Tragic 2.8% |
| Immigrants | Immigrants | 0.0 /100 | #296 | Tragic 2.8% |
| Immigrants | Cuba | 0.0 /100 | #297 | Tragic 2.8% |
| Immigrants | Dominica | 0.0 /100 | #298 | Tragic 2.8% |
| Central American Indians | 0.0 /100 | #299 | Tragic 2.8% |
| Haitians | 0.0 /100 | #300 | Tragic 2.9% |
| Immigrants | South Eastern Asia | 0.0 /100 | #301 | Tragic 2.9% |
| Immigrants | Caribbean | 0.0 /100 | #302 | Tragic 2.9% |
| Somalis | 0.0 /100 | #303 | Tragic 2.9% |