Immigrants from Laos vs Black/African American Male Disability
COMPARE
Immigrants from Laos
Black/African American
Male Disability
Male Disability Comparison
Immigrants from Laos
Blacks/African Americans
11.9%
MALE DISABILITY
1.0/ 100
METRIC RATING
244th/ 347
METRIC RANK
13.2%
MALE DISABILITY
0.0/ 100
METRIC RATING
304th/ 347
METRIC RANK
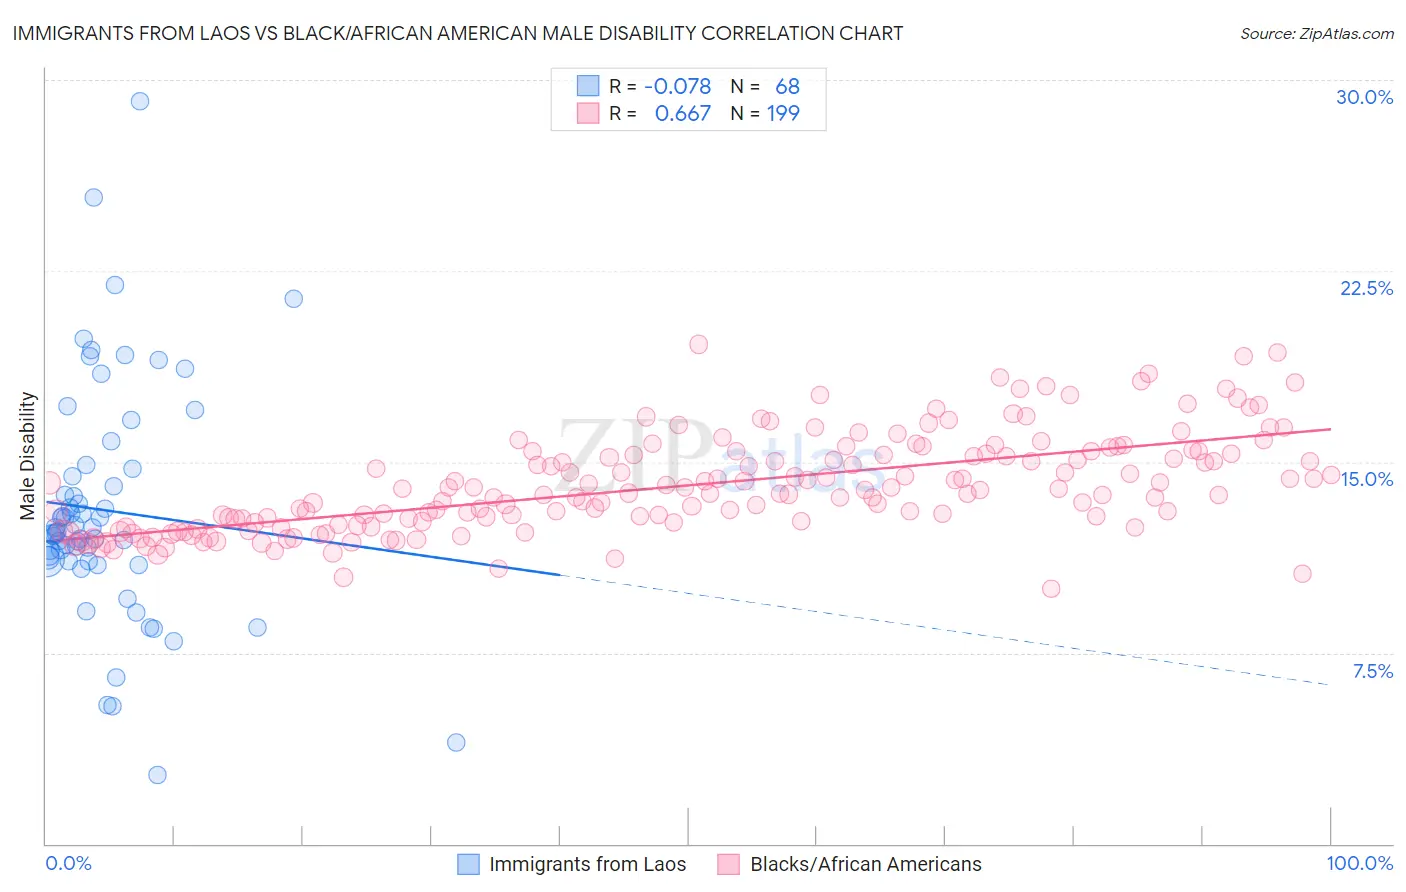
Immigrants from Laos vs Black/African American Male Disability Correlation Chart
The statistical analysis conducted on geographies consisting of 201,462,154 people shows a slight negative correlation between the proportion of Immigrants from Laos and percentage of males with a disability in the United States with a correlation coefficient (R) of -0.078 and weighted average of 11.9%. Similarly, the statistical analysis conducted on geographies consisting of 565,716,531 people shows a significant positive correlation between the proportion of Blacks/African Americans and percentage of males with a disability in the United States with a correlation coefficient (R) of 0.667 and weighted average of 13.2%, a difference of 10.9%.
Male Disability Correlation Summary
| Measurement | Immigrants from Laos | Black/African American |
| Minimum | 2.7% | 10.0% |
| Maximum | 29.2% | 19.6% |
| Range | 26.5% | 9.6% |
| Mean | 13.1% | 14.1% |
| Median | 12.2% | 13.7% |
| Interquartile 25% (IQ1) | 11.1% | 12.6% |
| Interquartile 75% (IQ3) | 14.6% | 15.3% |
| Interquartile Range (IQR) | 3.5% | 2.7% |
| Standard Deviation (Sample) | 4.6% | 1.9% |
| Standard Deviation (Population) | 4.6% | 1.9% |
Similar Demographics by Male Disability
Demographics Similar to Immigrants from Laos by Male Disability
In terms of male disability, the demographic groups most similar to Immigrants from Laos are Immigrants from Liberia (11.9%, a difference of 0.0%), Danish (11.9%, a difference of 0.040%), Samoan (11.9%, a difference of 0.11%), Northern European (11.9%, a difference of 0.14%), and Bahamian (11.9%, a difference of 0.16%).
| Demographics | Rating | Rank | Male Disability |
| Carpatho Rusyns | 1.3 /100 | #237 | Tragic 11.9% |
| Yugoslavians | 1.2 /100 | #238 | Tragic 11.9% |
| Italians | 1.2 /100 | #239 | Tragic 11.9% |
| Czechs | 1.1 /100 | #240 | Tragic 11.9% |
| Bahamians | 1.1 /100 | #241 | Tragic 11.9% |
| Northern Europeans | 1.1 /100 | #242 | Tragic 11.9% |
| Samoans | 1.1 /100 | #243 | Tragic 11.9% |
| Immigrants | Laos | 1.0 /100 | #244 | Tragic 11.9% |
| Immigrants | Liberia | 1.0 /100 | #245 | Tragic 11.9% |
| Danes | 0.9 /100 | #246 | Tragic 11.9% |
| Hungarians | 0.8 /100 | #247 | Tragic 12.0% |
| Poles | 0.7 /100 | #248 | Tragic 12.0% |
| Immigrants | Yemen | 0.5 /100 | #249 | Tragic 12.0% |
| Bangladeshis | 0.5 /100 | #250 | Tragic 12.0% |
| German Russians | 0.5 /100 | #251 | Tragic 12.0% |
Demographics Similar to Blacks/African Americans by Male Disability
In terms of male disability, the demographic groups most similar to Blacks/African Americans are Scotch-Irish (13.2%, a difference of 0.32%), French Canadian (13.3%, a difference of 0.41%), Spanish American (13.3%, a difference of 0.61%), Arapaho (13.3%, a difference of 0.84%), and Crow (13.1%, a difference of 0.87%).
| Demographics | Rating | Rank | Male Disability |
| Inupiat | 0.0 /100 | #297 | Tragic 13.0% |
| Pennsylvania Germans | 0.0 /100 | #298 | Tragic 13.0% |
| Celtics | 0.0 /100 | #299 | Tragic 13.0% |
| Cheyenne | 0.0 /100 | #300 | Tragic 13.0% |
| French | 0.0 /100 | #301 | Tragic 13.0% |
| Crow | 0.0 /100 | #302 | Tragic 13.1% |
| Scotch-Irish | 0.0 /100 | #303 | Tragic 13.2% |
| Blacks/African Americans | 0.0 /100 | #304 | Tragic 13.2% |
| French Canadians | 0.0 /100 | #305 | Tragic 13.3% |
| Spanish Americans | 0.0 /100 | #306 | Tragic 13.3% |
| Arapaho | 0.0 /100 | #307 | Tragic 13.3% |
| French American Indians | 0.0 /100 | #308 | Tragic 13.4% |
| Blackfeet | 0.0 /100 | #309 | Tragic 13.4% |
| Immigrants | Azores | 0.0 /100 | #310 | Tragic 13.4% |
| Delaware | 0.0 /100 | #311 | Tragic 13.5% |