Immigrants from Laos vs Latvian Unemployment Among Women with Children Ages 6 to 17 years
COMPARE
Immigrants from Laos
Latvian
Unemployment Among Women with Children Ages 6 to 17 years
Unemployment Among Women with Children Ages 6 to 17 years Comparison
Immigrants from Laos
Latvians
8.2%
UNEMPLOYMENT AMONG WOMEN WITH CHILDREN AGES 6 TO 17 YEARS
100.0/ 100
METRIC RATING
57th/ 347
METRIC RANK
8.6%
UNEMPLOYMENT AMONG WOMEN WITH CHILDREN AGES 6 TO 17 YEARS
97.4/ 100
METRIC RATING
110th/ 347
METRIC RANK
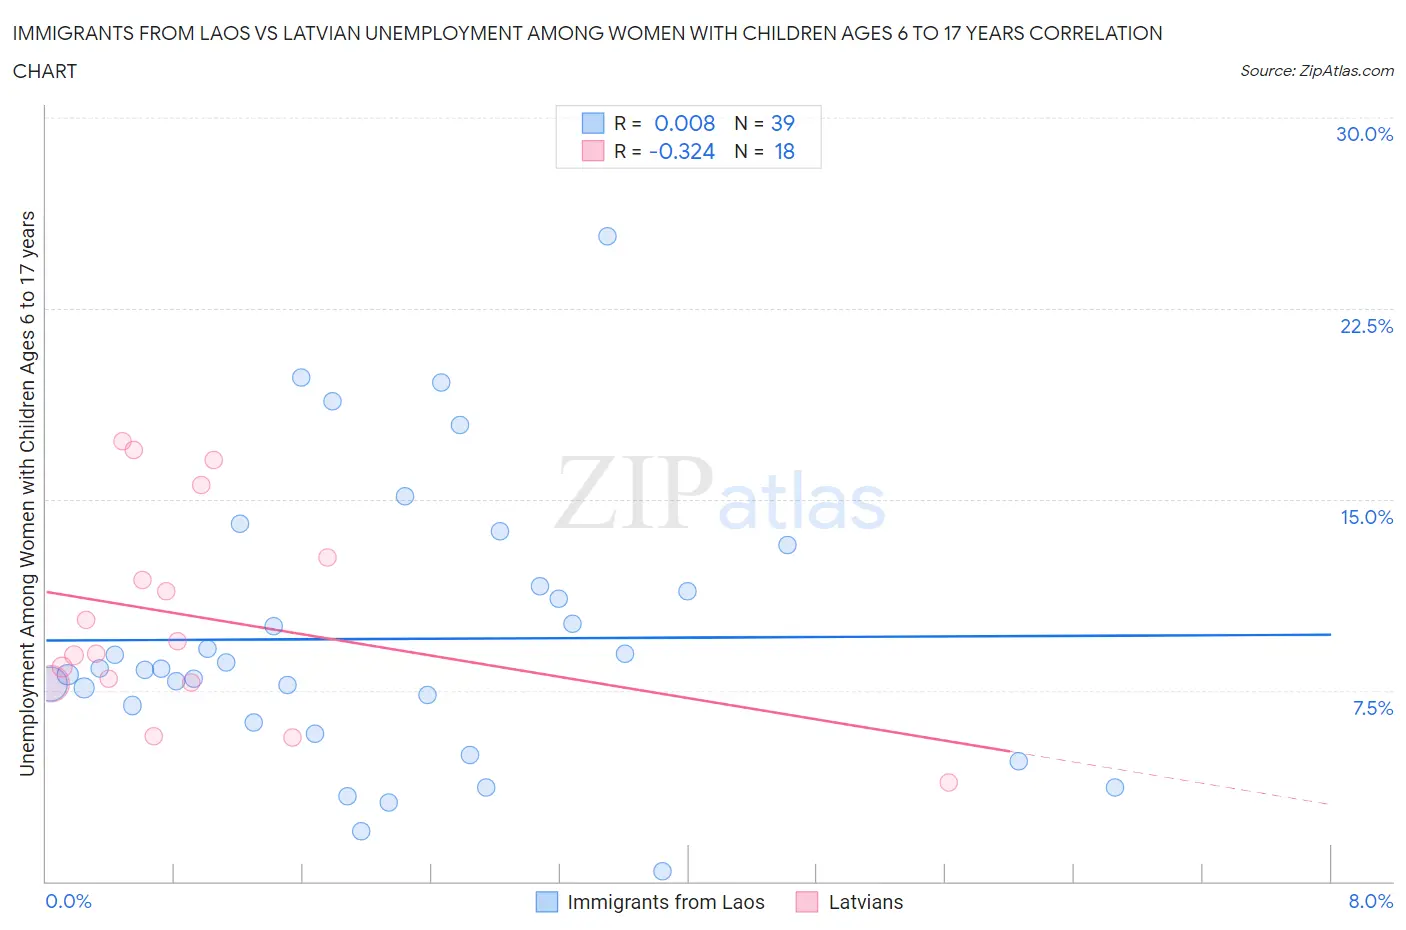
Immigrants from Laos vs Latvian Unemployment Among Women with Children Ages 6 to 17 years Correlation Chart
The statistical analysis conducted on geographies consisting of 166,241,149 people shows no correlation between the proportion of Immigrants from Laos and unemployment rate among women with children between the ages 6 and 17 in the United States with a correlation coefficient (R) of 0.008 and weighted average of 8.2%. Similarly, the statistical analysis conducted on geographies consisting of 167,334,916 people shows a mild negative correlation between the proportion of Latvians and unemployment rate among women with children between the ages 6 and 17 in the United States with a correlation coefficient (R) of -0.324 and weighted average of 8.6%, a difference of 5.4%.
Unemployment Among Women with Children Ages 6 to 17 years Correlation Summary
| Measurement | Immigrants from Laos | Latvian |
| Minimum | 0.40% | 3.9% |
| Maximum | 25.3% | 17.3% |
| Range | 24.9% | 13.4% |
| Mean | 9.5% | 10.4% |
| Median | 8.4% | 9.2% |
| Interquartile 25% (IQ1) | 6.2% | 7.8% |
| Interquartile 75% (IQ3) | 11.6% | 12.7% |
| Interquartile Range (IQR) | 5.4% | 4.9% |
| Standard Deviation (Sample) | 5.4% | 4.1% |
| Standard Deviation (Population) | 5.3% | 3.9% |
Similar Demographics by Unemployment Among Women with Children Ages 6 to 17 years
Demographics Similar to Immigrants from Laos by Unemployment Among Women with Children Ages 6 to 17 years
In terms of unemployment among women with children ages 6 to 17 years, the demographic groups most similar to Immigrants from Laos are Immigrants from Bosnia and Herzegovina (8.2%, a difference of 0.020%), Immigrants from Japan (8.2%, a difference of 0.030%), Immigrants from Armenia (8.2%, a difference of 0.10%), Immigrants from Malaysia (8.2%, a difference of 0.19%), and Immigrants from Philippines (8.2%, a difference of 0.26%).
| Demographics | Rating | Rank | Unemployment Among Women with Children Ages 6 to 17 years |
| Hawaiians | 100.0 /100 | #50 | Exceptional 8.1% |
| Immigrants | Sudan | 100.0 /100 | #51 | Exceptional 8.1% |
| Immigrants | Iraq | 100.0 /100 | #52 | Exceptional 8.1% |
| Danes | 100.0 /100 | #53 | Exceptional 8.1% |
| Immigrants | Armenia | 100.0 /100 | #54 | Exceptional 8.2% |
| Immigrants | Japan | 100.0 /100 | #55 | Exceptional 8.2% |
| Immigrants | Bosnia and Herzegovina | 100.0 /100 | #56 | Exceptional 8.2% |
| Immigrants | Laos | 100.0 /100 | #57 | Exceptional 8.2% |
| Immigrants | Malaysia | 100.0 /100 | #58 | Exceptional 8.2% |
| Immigrants | Philippines | 100.0 /100 | #59 | Exceptional 8.2% |
| Basques | 100.0 /100 | #60 | Exceptional 8.2% |
| Koreans | 100.0 /100 | #61 | Exceptional 8.2% |
| Spanish American Indians | 100.0 /100 | #62 | Exceptional 8.2% |
| Immigrants | South Eastern Asia | 99.9 /100 | #63 | Exceptional 8.2% |
| Immigrants | Kuwait | 99.9 /100 | #64 | Exceptional 8.3% |
Demographics Similar to Latvians by Unemployment Among Women with Children Ages 6 to 17 years
In terms of unemployment among women with children ages 6 to 17 years, the demographic groups most similar to Latvians are Immigrants from Romania (8.6%, a difference of 0.010%), Immigrants from Ukraine (8.6%, a difference of 0.010%), Swedish (8.6%, a difference of 0.080%), Chickasaw (8.6%, a difference of 0.090%), and Immigrants from Serbia (8.6%, a difference of 0.12%).
| Demographics | Rating | Rank | Unemployment Among Women with Children Ages 6 to 17 years |
| Scandinavians | 98.3 /100 | #103 | Exceptional 8.6% |
| Immigrants | France | 98.0 /100 | #104 | Exceptional 8.6% |
| Immigrants | Norway | 97.8 /100 | #105 | Exceptional 8.6% |
| Immigrants | Serbia | 97.7 /100 | #106 | Exceptional 8.6% |
| Chickasaw | 97.6 /100 | #107 | Exceptional 8.6% |
| Swedes | 97.6 /100 | #108 | Exceptional 8.6% |
| Immigrants | Romania | 97.5 /100 | #109 | Exceptional 8.6% |
| Latvians | 97.4 /100 | #110 | Exceptional 8.6% |
| Immigrants | Ukraine | 97.4 /100 | #111 | Exceptional 8.6% |
| Romanians | 97.1 /100 | #112 | Exceptional 8.6% |
| Eastern Europeans | 96.8 /100 | #113 | Exceptional 8.6% |
| Immigrants | Russia | 96.7 /100 | #114 | Exceptional 8.6% |
| Argentineans | 96.5 /100 | #115 | Exceptional 8.6% |
| Zimbabweans | 96.3 /100 | #116 | Exceptional 8.6% |
| Albanians | 96.3 /100 | #117 | Exceptional 8.6% |