Immigrants from Laos vs Ethiopian Female Disability
COMPARE
Immigrants from Laos
Ethiopian
Female Disability
Female Disability Comparison
Immigrants from Laos
Ethiopians
12.8%
FEMALE DISABILITY
0.4/ 100
METRIC RATING
268th/ 347
METRIC RANK
11.2%
FEMALE DISABILITY
100.0/ 100
METRIC RATING
37th/ 347
METRIC RANK
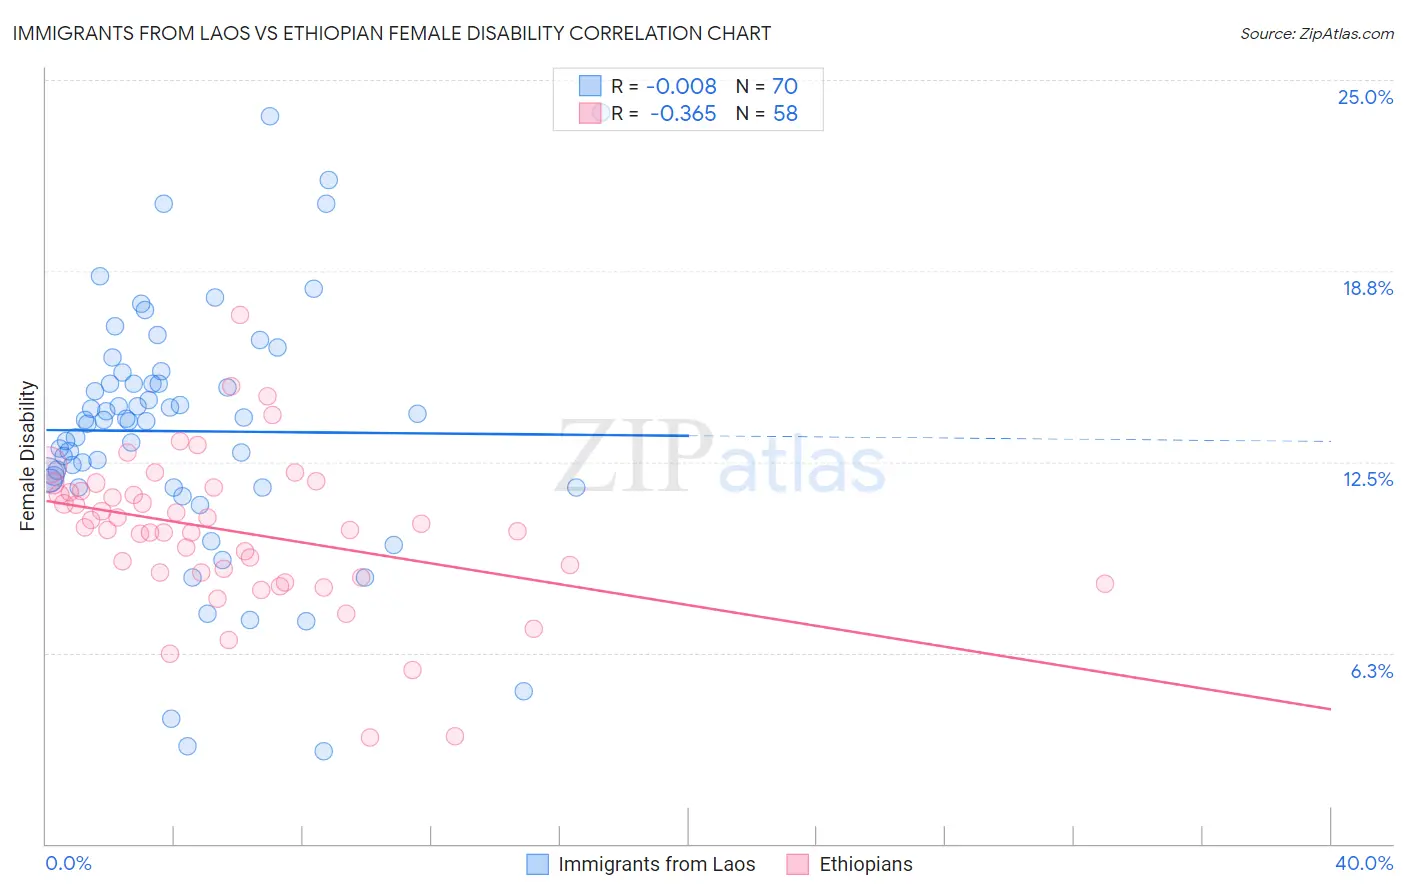
Immigrants from Laos vs Ethiopian Female Disability Correlation Chart
The statistical analysis conducted on geographies consisting of 201,465,776 people shows no correlation between the proportion of Immigrants from Laos and percentage of females with a disability in the United States with a correlation coefficient (R) of -0.008 and weighted average of 12.8%. Similarly, the statistical analysis conducted on geographies consisting of 223,237,211 people shows a mild negative correlation between the proportion of Ethiopians and percentage of females with a disability in the United States with a correlation coefficient (R) of -0.365 and weighted average of 11.2%, a difference of 14.6%.
Female Disability Correlation Summary
| Measurement | Immigrants from Laos | Ethiopian |
| Minimum | 3.0% | 3.5% |
| Maximum | 24.0% | 17.3% |
| Range | 20.9% | 13.8% |
| Mean | 13.5% | 10.2% |
| Median | 13.9% | 10.3% |
| Interquartile 25% (IQ1) | 11.7% | 8.9% |
| Interquartile 75% (IQ3) | 15.1% | 11.5% |
| Interquartile Range (IQR) | 3.4% | 2.7% |
| Standard Deviation (Sample) | 4.1% | 2.5% |
| Standard Deviation (Population) | 4.1% | 2.5% |
Similar Demographics by Female Disability
Demographics Similar to Immigrants from Laos by Female Disability
In terms of female disability, the demographic groups most similar to Immigrants from Laos are Senegalese (12.8%, a difference of 0.030%), Finnish (12.8%, a difference of 0.040%), Indonesian (12.8%, a difference of 0.060%), West Indian (12.8%, a difference of 0.16%), and Immigrants from Liberia (12.9%, a difference of 0.24%).
| Demographics | Rating | Rank | Female Disability |
| Bermudans | 1.0 /100 | #261 | Tragic 12.7% |
| Czechoslovakians | 0.9 /100 | #262 | Tragic 12.7% |
| Spaniards | 0.7 /100 | #263 | Tragic 12.8% |
| Alaska Natives | 0.6 /100 | #264 | Tragic 12.8% |
| West Indians | 0.5 /100 | #265 | Tragic 12.8% |
| Finns | 0.4 /100 | #266 | Tragic 12.8% |
| Senegalese | 0.4 /100 | #267 | Tragic 12.8% |
| Immigrants | Laos | 0.4 /100 | #268 | Tragic 12.8% |
| Indonesians | 0.4 /100 | #269 | Tragic 12.8% |
| Immigrants | Liberia | 0.3 /100 | #270 | Tragic 12.9% |
| Dutch | 0.2 /100 | #271 | Tragic 12.9% |
| Germans | 0.1 /100 | #272 | Tragic 12.9% |
| Sioux | 0.1 /100 | #273 | Tragic 12.9% |
| Portuguese | 0.1 /100 | #274 | Tragic 13.0% |
| Cheyenne | 0.1 /100 | #275 | Tragic 13.0% |
Demographics Similar to Ethiopians by Female Disability
In terms of female disability, the demographic groups most similar to Ethiopians are Cypriot (11.2%, a difference of 0.010%), Immigrants from Ethiopia (11.2%, a difference of 0.030%), Immigrants from Japan (11.2%, a difference of 0.080%), Immigrants from Indonesia (11.2%, a difference of 0.22%), and Immigrants from Lithuania (11.2%, a difference of 0.24%).
| Demographics | Rating | Rank | Female Disability |
| Turks | 100.0 /100 | #30 | Exceptional 11.1% |
| Immigrants | Kuwait | 100.0 /100 | #31 | Exceptional 11.1% |
| Immigrants | Australia | 100.0 /100 | #32 | Exceptional 11.1% |
| Immigrants | Egypt | 100.0 /100 | #33 | Exceptional 11.1% |
| Immigrants | Indonesia | 100.0 /100 | #34 | Exceptional 11.2% |
| Immigrants | Japan | 100.0 /100 | #35 | Exceptional 11.2% |
| Cypriots | 100.0 /100 | #36 | Exceptional 11.2% |
| Ethiopians | 100.0 /100 | #37 | Exceptional 11.2% |
| Immigrants | Ethiopia | 100.0 /100 | #38 | Exceptional 11.2% |
| Immigrants | Lithuania | 100.0 /100 | #39 | Exceptional 11.2% |
| Mongolians | 100.0 /100 | #40 | Exceptional 11.2% |
| Paraguayans | 100.0 /100 | #41 | Exceptional 11.2% |
| Israelis | 100.0 /100 | #42 | Exceptional 11.2% |
| Afghans | 100.0 /100 | #43 | Exceptional 11.2% |
| Cambodians | 100.0 /100 | #44 | Exceptional 11.3% |