Immigrants from Laos vs Ethiopian Bachelor's Degree
COMPARE
Immigrants from Laos
Ethiopian
Bachelor's Degree
Bachelor's Degree Comparison
Immigrants from Laos
Ethiopians
31.6%
BACHELOR'S DEGREE
0.1/ 100
METRIC RATING
280th/ 347
METRIC RANK
42.8%
BACHELOR'S DEGREE
99.5/ 100
METRIC RATING
72nd/ 347
METRIC RANK
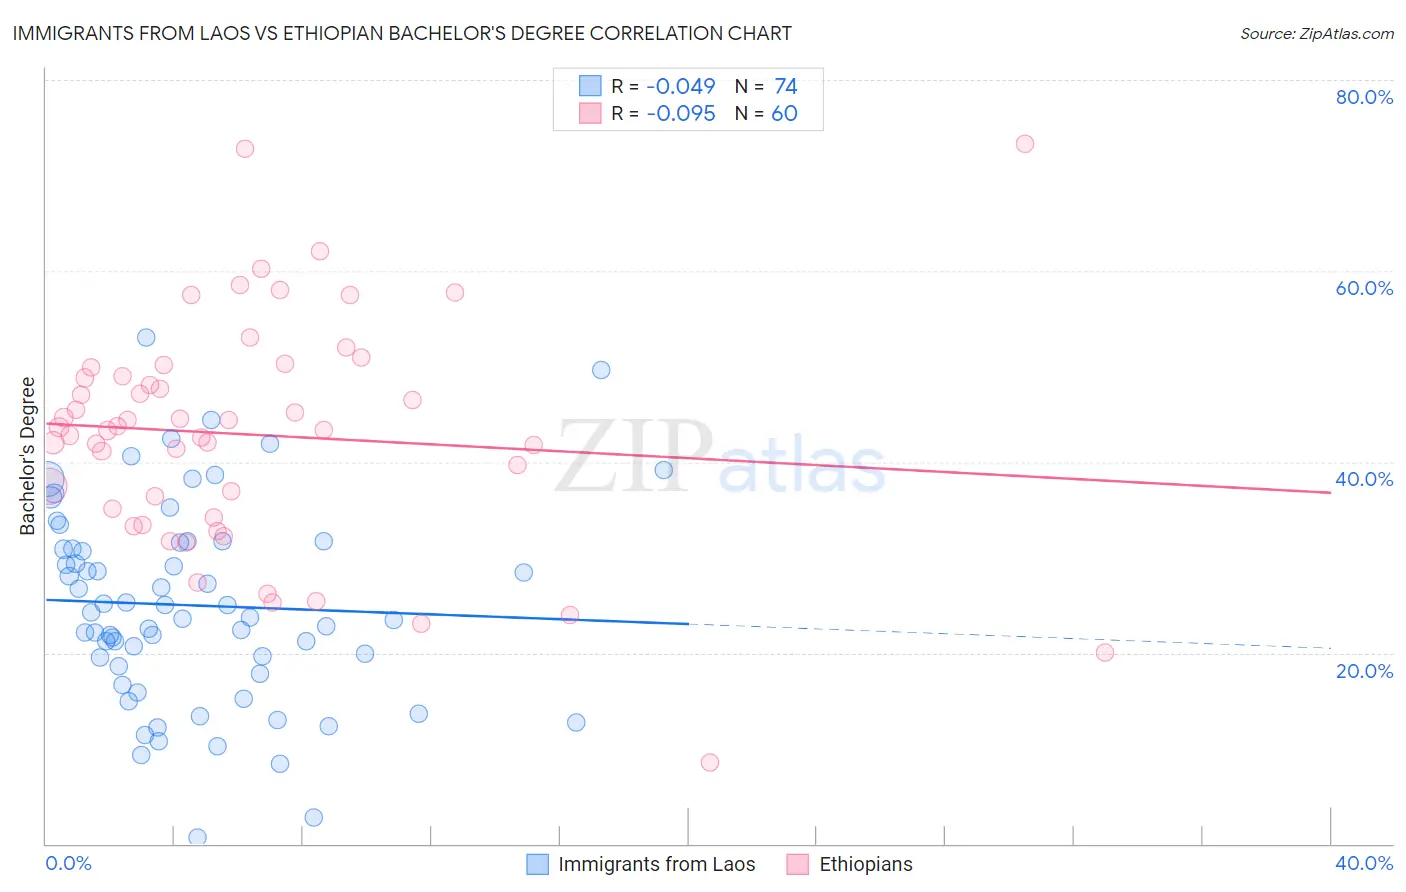
Immigrants from Laos vs Ethiopian Bachelor's Degree Correlation Chart
The statistical analysis conducted on geographies consisting of 201,474,630 people shows no correlation between the proportion of Immigrants from Laos and percentage of population with at least bachelor's degree education in the United States with a correlation coefficient (R) of -0.049 and weighted average of 31.6%. Similarly, the statistical analysis conducted on geographies consisting of 223,255,026 people shows a slight negative correlation between the proportion of Ethiopians and percentage of population with at least bachelor's degree education in the United States with a correlation coefficient (R) of -0.095 and weighted average of 42.8%, a difference of 35.3%.
Bachelor's Degree Correlation Summary
| Measurement | Immigrants from Laos | Ethiopian |
| Minimum | 0.64% | 8.5% |
| Maximum | 53.0% | 73.3% |
| Range | 52.4% | 64.9% |
| Mean | 25.0% | 42.8% |
| Median | 24.0% | 43.5% |
| Interquartile 25% (IQ1) | 18.6% | 34.6% |
| Interquartile 75% (IQ3) | 31.5% | 49.4% |
| Interquartile Range (IQR) | 12.9% | 14.8% |
| Standard Deviation (Sample) | 10.5% | 12.2% |
| Standard Deviation (Population) | 10.4% | 12.1% |
Similar Demographics by Bachelor's Degree
Demographics Similar to Immigrants from Laos by Bachelor's Degree
In terms of bachelor's degree, the demographic groups most similar to Immigrants from Laos are Hawaiian (31.6%, a difference of 0.050%), Marshallese (31.7%, a difference of 0.40%), Dominican (31.8%, a difference of 0.45%), Blackfeet (31.5%, a difference of 0.46%), and Salvadoran (31.8%, a difference of 0.60%).
| Demographics | Rating | Rank | Bachelor's Degree |
| Americans | 0.2 /100 | #273 | Tragic 31.9% |
| Potawatomi | 0.2 /100 | #274 | Tragic 31.9% |
| Samoans | 0.1 /100 | #275 | Tragic 31.8% |
| Salvadorans | 0.1 /100 | #276 | Tragic 31.8% |
| Dominicans | 0.1 /100 | #277 | Tragic 31.8% |
| Marshallese | 0.1 /100 | #278 | Tragic 31.7% |
| Hawaiians | 0.1 /100 | #279 | Tragic 31.6% |
| Immigrants | Laos | 0.1 /100 | #280 | Tragic 31.6% |
| Blackfeet | 0.1 /100 | #281 | Tragic 31.5% |
| Immigrants | Caribbean | 0.1 /100 | #282 | Tragic 31.4% |
| Hondurans | 0.1 /100 | #283 | Tragic 31.3% |
| Haitians | 0.1 /100 | #284 | Tragic 31.3% |
| Aleuts | 0.1 /100 | #285 | Tragic 31.3% |
| Immigrants | El Salvador | 0.1 /100 | #286 | Tragic 31.3% |
| Ottawa | 0.1 /100 | #287 | Tragic 31.1% |
Demographics Similar to Ethiopians by Bachelor's Degree
In terms of bachelor's degree, the demographic groups most similar to Ethiopians are Immigrants from Uzbekistan (42.8%, a difference of 0.050%), Immigrants from Argentina (42.8%, a difference of 0.090%), Bhutanese (42.7%, a difference of 0.27%), Immigrants from Romania (42.9%, a difference of 0.35%), and Immigrants from Zimbabwe (42.6%, a difference of 0.48%).
| Demographics | Rating | Rank | Bachelor's Degree |
| Zimbabweans | 99.7 /100 | #65 | Exceptional 43.3% |
| Immigrants | Netherlands | 99.7 /100 | #66 | Exceptional 43.3% |
| Egyptians | 99.7 /100 | #67 | Exceptional 43.3% |
| Immigrants | Indonesia | 99.7 /100 | #68 | Exceptional 43.3% |
| Immigrants | Pakistan | 99.7 /100 | #69 | Exceptional 43.1% |
| Immigrants | Romania | 99.6 /100 | #70 | Exceptional 42.9% |
| Immigrants | Argentina | 99.6 /100 | #71 | Exceptional 42.8% |
| Ethiopians | 99.5 /100 | #72 | Exceptional 42.8% |
| Immigrants | Uzbekistan | 99.5 /100 | #73 | Exceptional 42.8% |
| Bhutanese | 99.5 /100 | #74 | Exceptional 42.7% |
| Immigrants | Zimbabwe | 99.4 /100 | #75 | Exceptional 42.6% |
| Immigrants | Egypt | 99.4 /100 | #76 | Exceptional 42.6% |
| Immigrants | Eastern Europe | 99.4 /100 | #77 | Exceptional 42.5% |
| Immigrants | Ethiopia | 99.4 /100 | #78 | Exceptional 42.5% |
| Immigrants | Lebanon | 99.3 /100 | #79 | Exceptional 42.4% |