Immigrants from West Indies vs Ethiopian Female Disability
COMPARE
Immigrants from West Indies
Ethiopian
Female Disability
Female Disability Comparison
Immigrants from West Indies
Ethiopians
12.6%
FEMALE DISABILITY
4.4/ 100
METRIC RATING
236th/ 347
METRIC RANK
11.2%
FEMALE DISABILITY
100.0/ 100
METRIC RATING
37th/ 347
METRIC RANK
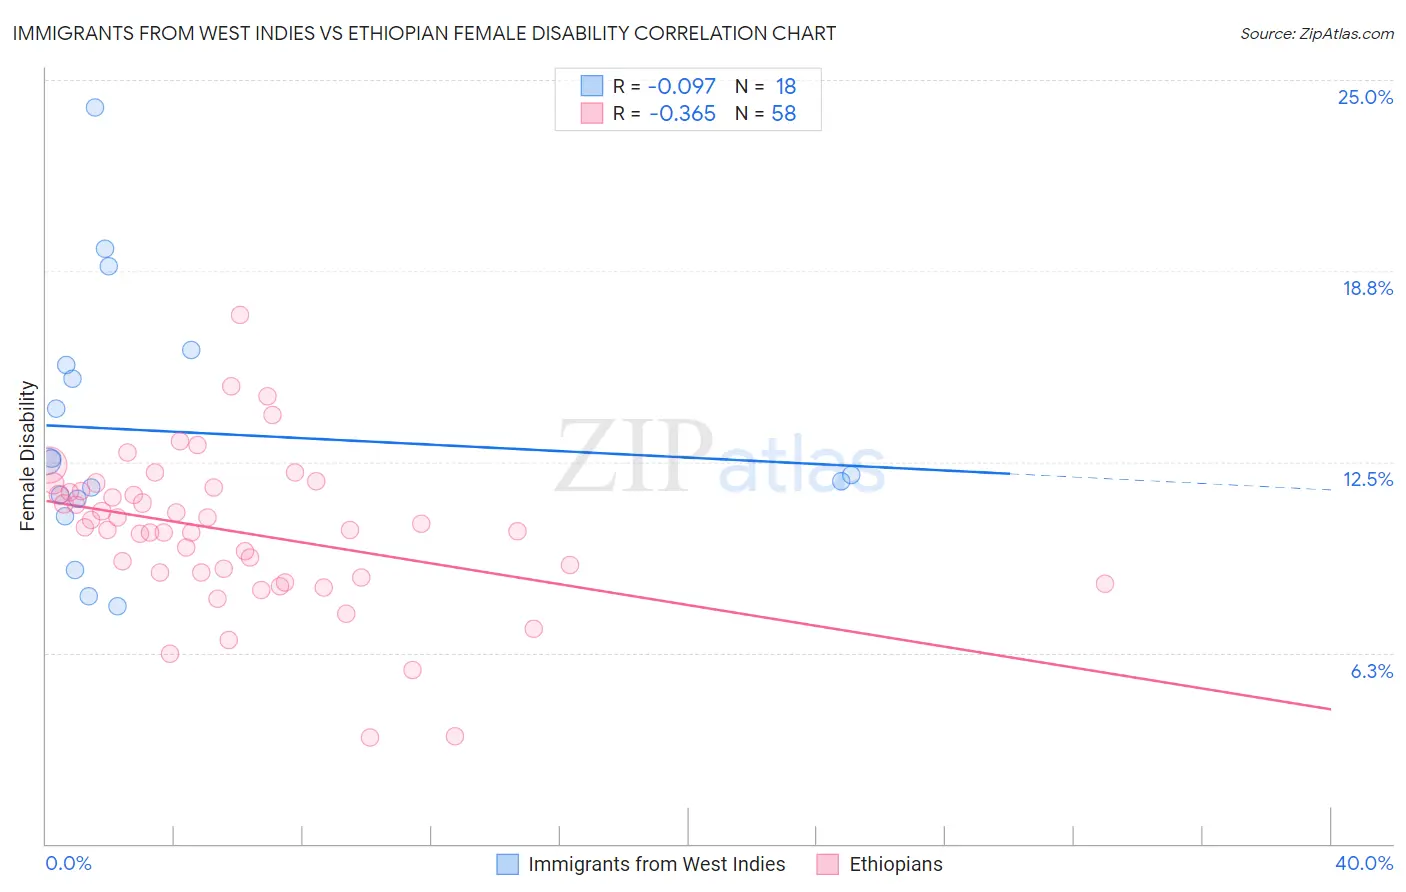
Immigrants from West Indies vs Ethiopian Female Disability Correlation Chart
The statistical analysis conducted on geographies consisting of 72,456,124 people shows a slight negative correlation between the proportion of Immigrants from West Indies and percentage of females with a disability in the United States with a correlation coefficient (R) of -0.097 and weighted average of 12.6%. Similarly, the statistical analysis conducted on geographies consisting of 223,237,211 people shows a mild negative correlation between the proportion of Ethiopians and percentage of females with a disability in the United States with a correlation coefficient (R) of -0.365 and weighted average of 11.2%, a difference of 12.1%.
Female Disability Correlation Summary
| Measurement | Immigrants from West Indies | Ethiopian |
| Minimum | 7.8% | 3.5% |
| Maximum | 24.1% | 17.3% |
| Range | 16.3% | 13.8% |
| Mean | 13.5% | 10.2% |
| Median | 12.3% | 10.3% |
| Interquartile 25% (IQ1) | 11.3% | 8.9% |
| Interquartile 75% (IQ3) | 15.7% | 11.5% |
| Interquartile Range (IQR) | 4.4% | 2.7% |
| Standard Deviation (Sample) | 4.2% | 2.5% |
| Standard Deviation (Population) | 4.1% | 2.5% |
Similar Demographics by Female Disability
Demographics Similar to Immigrants from West Indies by Female Disability
In terms of female disability, the demographic groups most similar to Immigrants from West Indies are Malaysian (12.5%, a difference of 0.13%), Slavic (12.6%, a difference of 0.13%), Yugoslavian (12.6%, a difference of 0.15%), Scandinavian (12.5%, a difference of 0.18%), and Immigrants from Iraq (12.5%, a difference of 0.19%).
| Demographics | Rating | Rank | Female Disability |
| Hungarians | 7.2 /100 | #229 | Tragic 12.5% |
| Immigrants | Belize | 7.0 /100 | #230 | Tragic 12.5% |
| Belgians | 6.5 /100 | #231 | Tragic 12.5% |
| Immigrants | Somalia | 5.9 /100 | #232 | Tragic 12.5% |
| Immigrants | Iraq | 5.3 /100 | #233 | Tragic 12.5% |
| Scandinavians | 5.3 /100 | #234 | Tragic 12.5% |
| Malaysians | 5.0 /100 | #235 | Tragic 12.5% |
| Immigrants | West Indies | 4.4 /100 | #236 | Tragic 12.6% |
| Slavs | 3.8 /100 | #237 | Tragic 12.6% |
| Yugoslavians | 3.7 /100 | #238 | Tragic 12.6% |
| Barbadians | 3.6 /100 | #239 | Tragic 12.6% |
| German Russians | 3.2 /100 | #240 | Tragic 12.6% |
| Japanese | 2.7 /100 | #241 | Tragic 12.6% |
| Canadians | 2.6 /100 | #242 | Tragic 12.6% |
| Immigrants | Senegal | 2.5 /100 | #243 | Tragic 12.6% |
Demographics Similar to Ethiopians by Female Disability
In terms of female disability, the demographic groups most similar to Ethiopians are Cypriot (11.2%, a difference of 0.010%), Immigrants from Ethiopia (11.2%, a difference of 0.030%), Immigrants from Japan (11.2%, a difference of 0.080%), Immigrants from Indonesia (11.2%, a difference of 0.22%), and Immigrants from Lithuania (11.2%, a difference of 0.24%).
| Demographics | Rating | Rank | Female Disability |
| Turks | 100.0 /100 | #30 | Exceptional 11.1% |
| Immigrants | Kuwait | 100.0 /100 | #31 | Exceptional 11.1% |
| Immigrants | Australia | 100.0 /100 | #32 | Exceptional 11.1% |
| Immigrants | Egypt | 100.0 /100 | #33 | Exceptional 11.1% |
| Immigrants | Indonesia | 100.0 /100 | #34 | Exceptional 11.2% |
| Immigrants | Japan | 100.0 /100 | #35 | Exceptional 11.2% |
| Cypriots | 100.0 /100 | #36 | Exceptional 11.2% |
| Ethiopians | 100.0 /100 | #37 | Exceptional 11.2% |
| Immigrants | Ethiopia | 100.0 /100 | #38 | Exceptional 11.2% |
| Immigrants | Lithuania | 100.0 /100 | #39 | Exceptional 11.2% |
| Mongolians | 100.0 /100 | #40 | Exceptional 11.2% |
| Paraguayans | 100.0 /100 | #41 | Exceptional 11.2% |
| Israelis | 100.0 /100 | #42 | Exceptional 11.2% |
| Afghans | 100.0 /100 | #43 | Exceptional 11.2% |
| Cambodians | 100.0 /100 | #44 | Exceptional 11.3% |