Immigrants from Kuwait vs Puerto Rican Self-Care Disability
COMPARE
Immigrants from Kuwait
Puerto Rican
Self-Care Disability
Self-Care Disability Comparison
Immigrants from Kuwait
Puerto Ricans
2.2%
SELF-CARE DISABILITY
100.0/ 100
METRIC RATING
16th/ 347
METRIC RANK
3.7%
SELF-CARE DISABILITY
0.0/ 100
METRIC RATING
346th/ 347
METRIC RANK
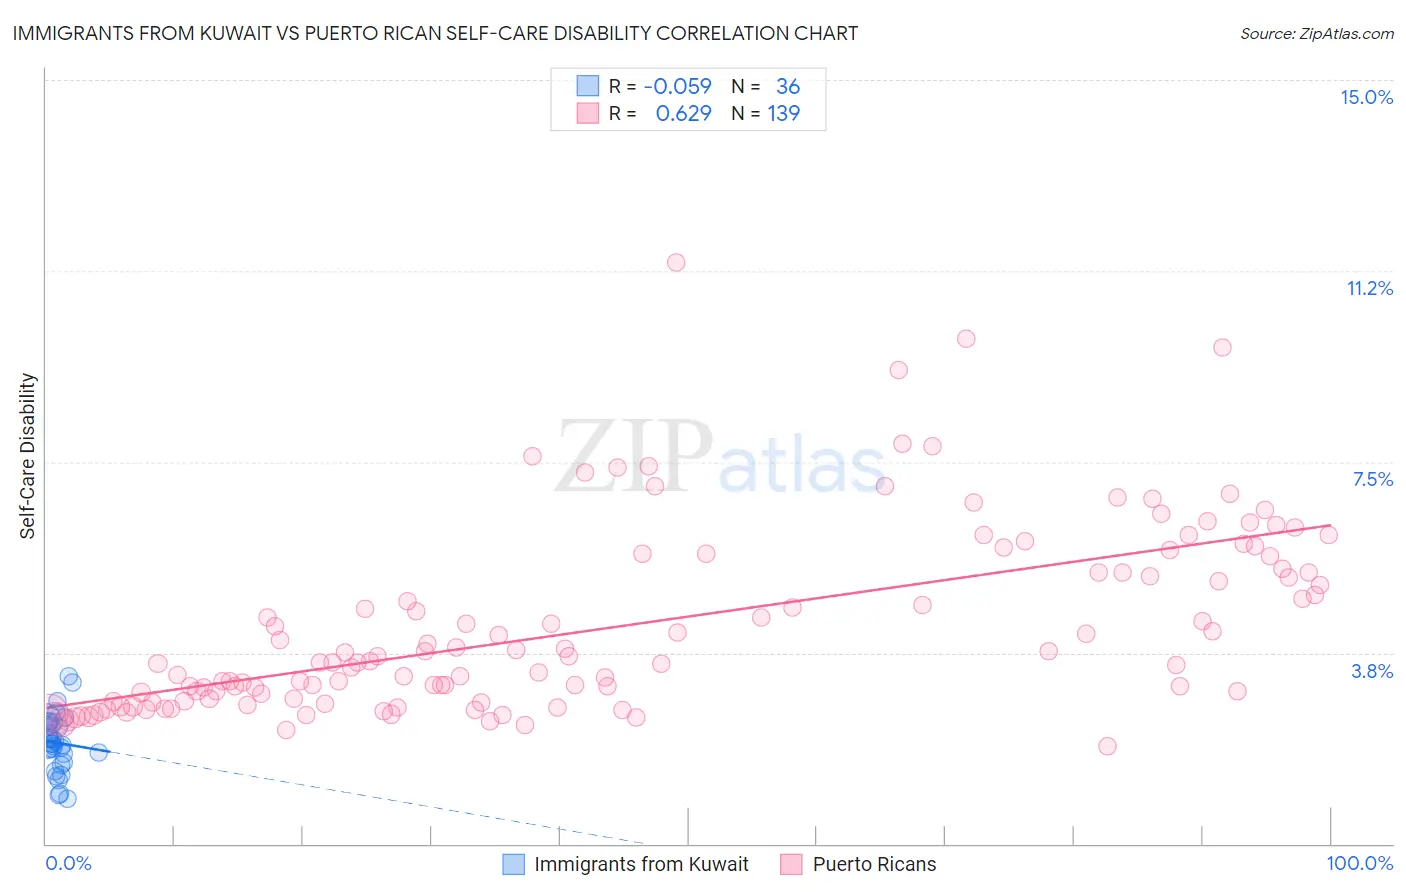
Immigrants from Kuwait vs Puerto Rican Self-Care Disability Correlation Chart
The statistical analysis conducted on geographies consisting of 136,859,036 people shows a slight negative correlation between the proportion of Immigrants from Kuwait and percentage of population with self-care disability in the United States with a correlation coefficient (R) of -0.059 and weighted average of 2.2%. Similarly, the statistical analysis conducted on geographies consisting of 527,012,909 people shows a significant positive correlation between the proportion of Puerto Ricans and percentage of population with self-care disability in the United States with a correlation coefficient (R) of 0.629 and weighted average of 3.7%, a difference of 66.8%.
Self-Care Disability Correlation Summary
| Measurement | Immigrants from Kuwait | Puerto Rican |
| Minimum | 0.88% | 1.9% |
| Maximum | 3.3% | 11.4% |
| Range | 2.4% | 9.5% |
| Mean | 2.0% | 4.3% |
| Median | 2.0% | 3.6% |
| Interquartile 25% (IQ1) | 1.7% | 2.8% |
| Interquartile 75% (IQ3) | 2.3% | 5.3% |
| Interquartile Range (IQR) | 0.67% | 2.5% |
| Standard Deviation (Sample) | 0.56% | 1.8% |
| Standard Deviation (Population) | 0.55% | 1.8% |
Similar Demographics by Self-Care Disability
Demographics Similar to Immigrants from Kuwait by Self-Care Disability
In terms of self-care disability, the demographic groups most similar to Immigrants from Kuwait are Immigrants from Saudi Arabia (2.2%, a difference of 0.16%), Okinawan (2.2%, a difference of 0.28%), Luxembourger (2.2%, a difference of 0.29%), Immigrants from Taiwan (2.2%, a difference of 0.42%), and Ethiopian (2.2%, a difference of 0.45%).
| Demographics | Rating | Rank | Self-Care Disability |
| Immigrants | Nepal | 100.0 /100 | #9 | Exceptional 2.2% |
| Sudanese | 100.0 /100 | #10 | Exceptional 2.2% |
| Immigrants | South Central Asia | 100.0 /100 | #11 | Exceptional 2.2% |
| Immigrants | Ethiopia | 100.0 /100 | #12 | Exceptional 2.2% |
| Ethiopians | 100.0 /100 | #13 | Exceptional 2.2% |
| Luxembourgers | 100.0 /100 | #14 | Exceptional 2.2% |
| Okinawans | 100.0 /100 | #15 | Exceptional 2.2% |
| Immigrants | Kuwait | 100.0 /100 | #16 | Exceptional 2.2% |
| Immigrants | Saudi Arabia | 100.0 /100 | #17 | Exceptional 2.2% |
| Immigrants | Taiwan | 100.0 /100 | #18 | Exceptional 2.2% |
| Immigrants | Eritrea | 100.0 /100 | #19 | Exceptional 2.2% |
| Tongans | 100.0 /100 | #20 | Exceptional 2.2% |
| Bulgarians | 100.0 /100 | #21 | Exceptional 2.2% |
| Immigrants | Venezuela | 100.0 /100 | #22 | Exceptional 2.2% |
| Cambodians | 100.0 /100 | #23 | Exceptional 2.2% |
Demographics Similar to Puerto Ricans by Self-Care Disability
In terms of self-care disability, the demographic groups most similar to Puerto Ricans are Armenian (3.4%, a difference of 8.0%), Pueblo (3.3%, a difference of 12.8%), Immigrants from Armenia (4.2%, a difference of 13.7%), Tohono O'odham (3.1%, a difference of 18.0%), and Colville (3.1%, a difference of 18.1%).
| Demographics | Rating | Rank | Self-Care Disability |
| Dutch West Indians | 0.0 /100 | #333 | Tragic 3.0% |
| Houma | 0.0 /100 | #334 | Tragic 3.0% |
| Immigrants | Azores | 0.0 /100 | #335 | Tragic 3.0% |
| Immigrants | Yemen | 0.0 /100 | #336 | Tragic 3.0% |
| Choctaw | 0.0 /100 | #337 | Tragic 3.0% |
| Cape Verdeans | 0.0 /100 | #338 | Tragic 3.0% |
| Immigrants | Dominican Republic | 0.0 /100 | #339 | Tragic 3.0% |
| Immigrants | Cabo Verde | 0.0 /100 | #340 | Tragic 3.1% |
| Dominicans | 0.0 /100 | #341 | Tragic 3.1% |
| Colville | 0.0 /100 | #342 | Tragic 3.1% |
| Tohono O'odham | 0.0 /100 | #343 | Tragic 3.1% |
| Pueblo | 0.0 /100 | #344 | Tragic 3.3% |
| Armenians | 0.0 /100 | #345 | Tragic 3.4% |
| Puerto Ricans | 0.0 /100 | #346 | Tragic 3.7% |
| Immigrants | Armenia | 0.0 /100 | #347 | Tragic 4.2% |