Immigrants from Korea vs Immigrants from Barbados Cognitive Disability
COMPARE
Immigrants from Korea
Immigrants from Barbados
Cognitive Disability
Cognitive Disability Comparison
Immigrants from Korea
Immigrants from Barbados
16.5%
COGNITIVE DISABILITY
99.8/ 100
METRIC RATING
51st/ 347
METRIC RANK
17.9%
COGNITIVE DISABILITY
0.4/ 100
METRIC RATING
263rd/ 347
METRIC RANK
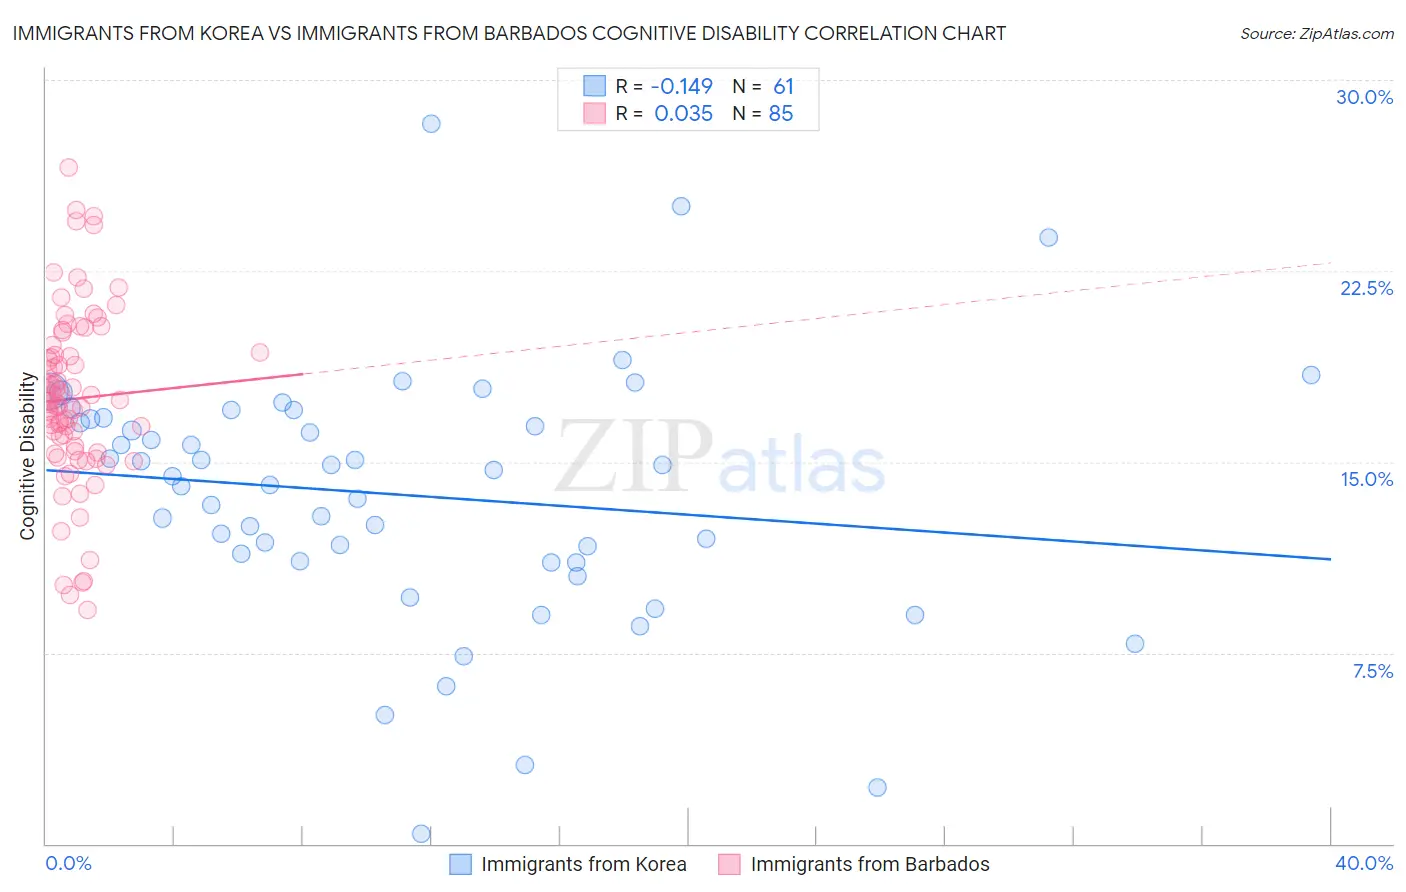
Immigrants from Korea vs Immigrants from Barbados Cognitive Disability Correlation Chart
The statistical analysis conducted on geographies consisting of 416,300,035 people shows a poor negative correlation between the proportion of Immigrants from Korea and percentage of population with cognitive disability in the United States with a correlation coefficient (R) of -0.149 and weighted average of 16.5%. Similarly, the statistical analysis conducted on geographies consisting of 112,774,793 people shows no correlation between the proportion of Immigrants from Barbados and percentage of population with cognitive disability in the United States with a correlation coefficient (R) of 0.035 and weighted average of 17.9%, a difference of 8.7%.
Cognitive Disability Correlation Summary
| Measurement | Immigrants from Korea | Immigrants from Barbados |
| Minimum | 0.40% | 9.2% |
| Maximum | 28.3% | 26.5% |
| Range | 27.9% | 17.4% |
| Mean | 13.7% | 17.5% |
| Median | 14.4% | 17.3% |
| Interquartile 25% (IQ1) | 11.1% | 15.4% |
| Interquartile 75% (IQ3) | 16.7% | 19.4% |
| Interquartile Range (IQR) | 5.6% | 4.0% |
| Standard Deviation (Sample) | 5.0% | 3.5% |
| Standard Deviation (Population) | 4.9% | 3.4% |
Similar Demographics by Cognitive Disability
Demographics Similar to Immigrants from Korea by Cognitive Disability
In terms of cognitive disability, the demographic groups most similar to Immigrants from Korea are Soviet Union (16.5%, a difference of 0.040%), Iranian (16.5%, a difference of 0.050%), Norwegian (16.5%, a difference of 0.050%), Immigrants from Italy (16.5%, a difference of 0.090%), and Immigrants from North America (16.5%, a difference of 0.090%).
| Demographics | Rating | Rank | Cognitive Disability |
| Macedonians | 99.8 /100 | #44 | Exceptional 16.5% |
| Immigrants | Europe | 99.8 /100 | #45 | Exceptional 16.5% |
| Immigrants | Colombia | 99.8 /100 | #46 | Exceptional 16.5% |
| Immigrants | Italy | 99.8 /100 | #47 | Exceptional 16.5% |
| Immigrants | North America | 99.8 /100 | #48 | Exceptional 16.5% |
| Iranians | 99.8 /100 | #49 | Exceptional 16.5% |
| Norwegians | 99.8 /100 | #50 | Exceptional 16.5% |
| Immigrants | Korea | 99.8 /100 | #51 | Exceptional 16.5% |
| Soviet Union | 99.8 /100 | #52 | Exceptional 16.5% |
| Swedes | 99.8 /100 | #53 | Exceptional 16.5% |
| Immigrants | Iran | 99.8 /100 | #54 | Exceptional 16.5% |
| Immigrants | Venezuela | 99.7 /100 | #55 | Exceptional 16.5% |
| Austrians | 99.7 /100 | #56 | Exceptional 16.6% |
| Bhutanese | 99.7 /100 | #57 | Exceptional 16.6% |
| Pennsylvania Germans | 99.7 /100 | #58 | Exceptional 16.6% |
Demographics Similar to Immigrants from Barbados by Cognitive Disability
In terms of cognitive disability, the demographic groups most similar to Immigrants from Barbados are Sierra Leonean (17.9%, a difference of 0.040%), Menominee (18.0%, a difference of 0.060%), Guamanian/Chamorro (17.9%, a difference of 0.070%), Spanish American (18.0%, a difference of 0.090%), and Belizean (18.0%, a difference of 0.090%).
| Demographics | Rating | Rank | Cognitive Disability |
| Bahamians | 0.6 /100 | #256 | Tragic 17.9% |
| Mexican American Indians | 0.6 /100 | #257 | Tragic 17.9% |
| Immigrants | Armenia | 0.6 /100 | #258 | Tragic 17.9% |
| Ethiopians | 0.5 /100 | #259 | Tragic 17.9% |
| Immigrants | Belize | 0.5 /100 | #260 | Tragic 17.9% |
| Guamanians/Chamorros | 0.5 /100 | #261 | Tragic 17.9% |
| Sierra Leoneans | 0.4 /100 | #262 | Tragic 17.9% |
| Immigrants | Barbados | 0.4 /100 | #263 | Tragic 17.9% |
| Menominee | 0.4 /100 | #264 | Tragic 18.0% |
| Spanish Americans | 0.4 /100 | #265 | Tragic 18.0% |
| Belizeans | 0.4 /100 | #266 | Tragic 18.0% |
| Nepalese | 0.3 /100 | #267 | Tragic 18.0% |
| Cherokee | 0.3 /100 | #268 | Tragic 18.0% |
| Hondurans | 0.3 /100 | #269 | Tragic 18.0% |
| Immigrants | Bahamas | 0.3 /100 | #270 | Tragic 18.0% |