Immigrants from Panama vs Immigrants from Central America Disability Age Over 75
COMPARE
Immigrants from Panama
Immigrants from Central America
Disability Age Over 75
Disability Age Over 75 Comparison
Immigrants from Panama
Immigrants from Central America
47.9%
DISABILITY AGE OVER 75
10.2/ 100
METRIC RATING
216th/ 347
METRIC RANK
50.5%
DISABILITY AGE OVER 75
0.0/ 100
METRIC RATING
306th/ 347
METRIC RANK
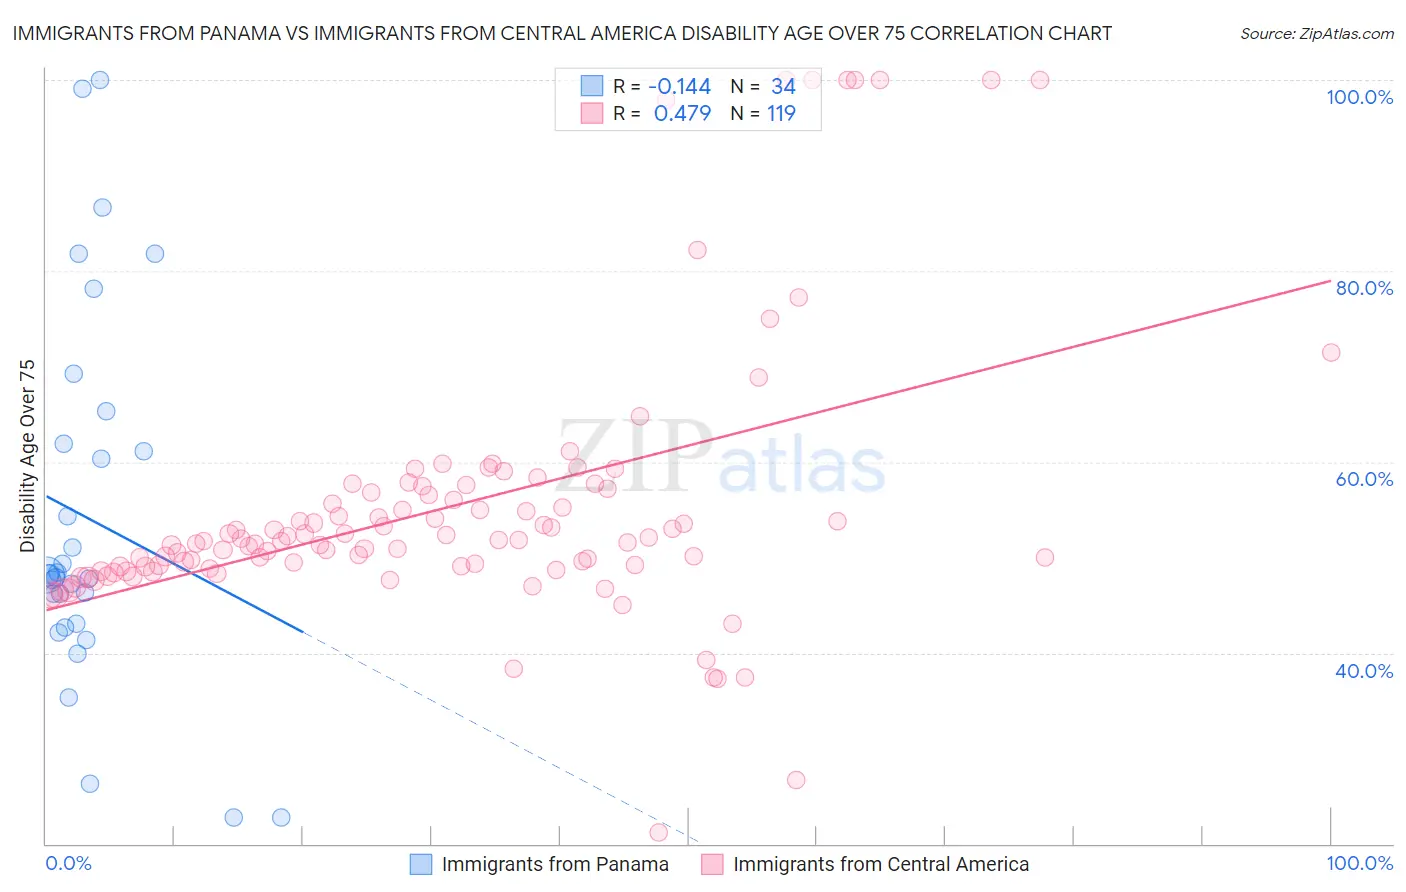
Immigrants from Panama vs Immigrants from Central America Disability Age Over 75 Correlation Chart
The statistical analysis conducted on geographies consisting of 221,086,217 people shows a poor negative correlation between the proportion of Immigrants from Panama and percentage of population with a disability over the age of 75 in the United States with a correlation coefficient (R) of -0.144 and weighted average of 47.9%. Similarly, the statistical analysis conducted on geographies consisting of 534,859,975 people shows a moderate positive correlation between the proportion of Immigrants from Central America and percentage of population with a disability over the age of 75 in the United States with a correlation coefficient (R) of 0.479 and weighted average of 50.5%, a difference of 5.5%.
Disability Age Over 75 Correlation Summary
| Measurement | Immigrants from Panama | Immigrants from Central America |
| Minimum | 22.7% | 21.2% |
| Maximum | 100.0% | 100.0% |
| Range | 77.3% | 78.8% |
| Mean | 54.1% | 55.2% |
| Median | 48.1% | 51.7% |
| Interquartile 25% (IQ1) | 43.1% | 49.0% |
| Interquartile 75% (IQ3) | 61.9% | 56.7% |
| Interquartile Range (IQR) | 18.8% | 7.7% |
| Standard Deviation (Sample) | 19.2% | 14.3% |
| Standard Deviation (Population) | 18.9% | 14.2% |
Similar Demographics by Disability Age Over 75
Demographics Similar to Immigrants from Panama by Disability Age Over 75
In terms of disability age over 75, the demographic groups most similar to Immigrants from Panama are Immigrants from Barbados (47.9%, a difference of 0.030%), Senegalese (47.9%, a difference of 0.030%), Immigrants from Grenada (47.9%, a difference of 0.050%), Laotian (47.9%, a difference of 0.070%), and Immigrants from Burma/Myanmar (47.9%, a difference of 0.080%).
| Demographics | Rating | Rank | Disability Age Over 75 |
| Immigrants | Indonesia | 14.2 /100 | #209 | Poor 47.8% |
| Vietnamese | 11.9 /100 | #210 | Poor 47.9% |
| Panamanians | 11.8 /100 | #211 | Poor 47.9% |
| Immigrants | Burma/Myanmar | 11.7 /100 | #212 | Poor 47.9% |
| Laotians | 11.5 /100 | #213 | Poor 47.9% |
| Immigrants | Barbados | 10.7 /100 | #214 | Poor 47.9% |
| Senegalese | 10.7 /100 | #215 | Poor 47.9% |
| Immigrants | Panama | 10.2 /100 | #216 | Poor 47.9% |
| Immigrants | Grenada | 9.4 /100 | #217 | Tragic 47.9% |
| Immigrants | Western Africa | 8.3 /100 | #218 | Tragic 48.0% |
| Immigrants | Western Asia | 7.5 /100 | #219 | Tragic 48.0% |
| Bahamians | 7.4 /100 | #220 | Tragic 48.0% |
| Immigrants | Oceania | 7.3 /100 | #221 | Tragic 48.0% |
| Barbadians | 6.8 /100 | #222 | Tragic 48.0% |
| Immigrants | Bangladesh | 6.8 /100 | #223 | Tragic 48.0% |
Demographics Similar to Immigrants from Central America by Disability Age Over 75
In terms of disability age over 75, the demographic groups most similar to Immigrants from Central America are Immigrants from Fiji (50.6%, a difference of 0.060%), Hispanic or Latino (50.6%, a difference of 0.080%), Aleut (50.6%, a difference of 0.080%), Central American Indian (50.5%, a difference of 0.090%), and Tlingit-Haida (50.6%, a difference of 0.12%).
| Demographics | Rating | Rank | Disability Age Over 75 |
| Immigrants | Micronesia | 0.0 /100 | #299 | Tragic 50.1% |
| Cape Verdeans | 0.0 /100 | #300 | Tragic 50.1% |
| Dominicans | 0.0 /100 | #301 | Tragic 50.2% |
| Cherokee | 0.0 /100 | #302 | Tragic 50.2% |
| Japanese | 0.0 /100 | #303 | Tragic 50.2% |
| Immigrants | Dominican Republic | 0.0 /100 | #304 | Tragic 50.3% |
| Central American Indians | 0.0 /100 | #305 | Tragic 50.5% |
| Immigrants | Central America | 0.0 /100 | #306 | Tragic 50.5% |
| Immigrants | Fiji | 0.0 /100 | #307 | Tragic 50.6% |
| Hispanics or Latinos | 0.0 /100 | #308 | Tragic 50.6% |
| Aleuts | 0.0 /100 | #309 | Tragic 50.6% |
| Tlingit-Haida | 0.0 /100 | #310 | Tragic 50.6% |
| Cajuns | 0.0 /100 | #311 | Tragic 50.7% |
| Cheyenne | 0.0 /100 | #312 | Tragic 50.9% |
| Immigrants | Azores | 0.0 /100 | #313 | Tragic 50.9% |