Immigrants from Kenya vs Bahamian Disability Age Over 75
COMPARE
Immigrants from Kenya
Bahamian
Disability Age Over 75
Disability Age Over 75 Comparison
Immigrants from Kenya
Bahamians
47.6%
DISABILITY AGE OVER 75
30.8/ 100
METRIC RATING
189th/ 347
METRIC RANK
48.0%
DISABILITY AGE OVER 75
7.4/ 100
METRIC RATING
220th/ 347
METRIC RANK
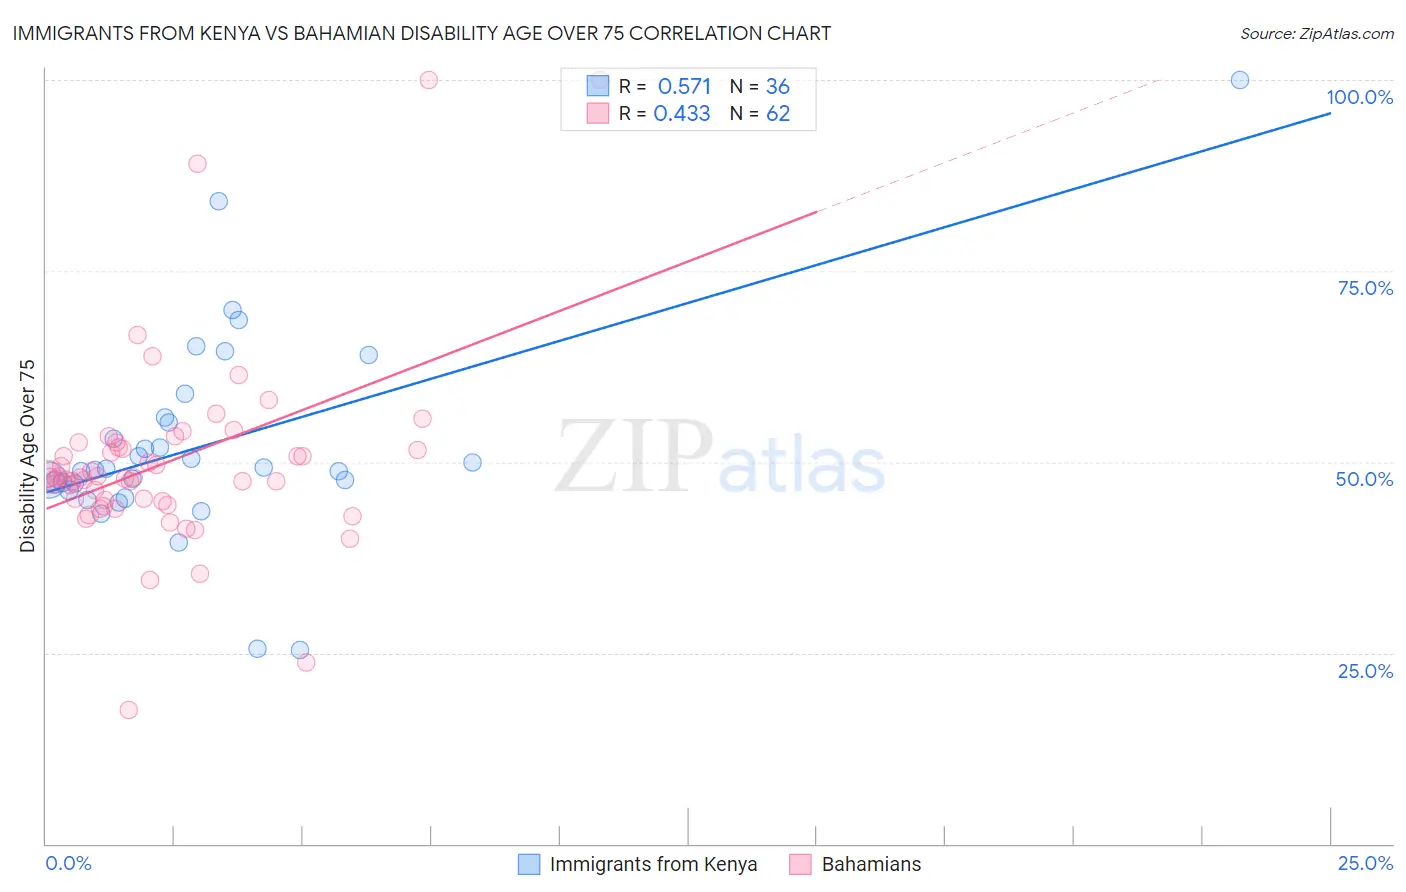
Immigrants from Kenya vs Bahamian Disability Age Over 75 Correlation Chart
The statistical analysis conducted on geographies consisting of 217,778,670 people shows a substantial positive correlation between the proportion of Immigrants from Kenya and percentage of population with a disability over the age of 75 in the United States with a correlation coefficient (R) of 0.571 and weighted average of 47.6%. Similarly, the statistical analysis conducted on geographies consisting of 112,565,508 people shows a moderate positive correlation between the proportion of Bahamians and percentage of population with a disability over the age of 75 in the United States with a correlation coefficient (R) of 0.433 and weighted average of 48.0%, a difference of 0.96%.
Disability Age Over 75 Correlation Summary
| Measurement | Immigrants from Kenya | Bahamian |
| Minimum | 25.4% | 17.5% |
| Maximum | 100.0% | 100.0% |
| Range | 74.6% | 82.5% |
| Mean | 52.3% | 50.0% |
| Median | 49.0% | 48.0% |
| Interquartile 25% (IQ1) | 46.7% | 44.9% |
| Interquartile 75% (IQ3) | 55.5% | 51.8% |
| Interquartile Range (IQR) | 8.8% | 6.9% |
| Standard Deviation (Sample) | 13.7% | 13.0% |
| Standard Deviation (Population) | 13.5% | 12.9% |
Similar Demographics by Disability Age Over 75
Demographics Similar to Immigrants from Kenya by Disability Age Over 75
In terms of disability age over 75, the demographic groups most similar to Immigrants from Kenya are Basque (47.6%, a difference of 0.0%), Immigrants from Sudan (47.5%, a difference of 0.020%), Sudanese (47.5%, a difference of 0.030%), Somali (47.6%, a difference of 0.040%), and Portuguese (47.6%, a difference of 0.040%).
| Demographics | Rating | Rank | Disability Age Over 75 |
| Immigrants | Moldova | 39.9 /100 | #182 | Fair 47.4% |
| Delaware | 39.1 /100 | #183 | Fair 47.5% |
| Immigrants | Nigeria | 34.0 /100 | #184 | Fair 47.5% |
| Ghanaians | 33.0 /100 | #185 | Fair 47.5% |
| Sudanese | 32.0 /100 | #186 | Fair 47.5% |
| Immigrants | Sudan | 31.8 /100 | #187 | Fair 47.5% |
| Basques | 30.9 /100 | #188 | Fair 47.6% |
| Immigrants | Kenya | 30.8 /100 | #189 | Fair 47.6% |
| Somalis | 29.5 /100 | #190 | Fair 47.6% |
| Portuguese | 29.3 /100 | #191 | Fair 47.6% |
| Immigrants | Jamaica | 28.3 /100 | #192 | Fair 47.6% |
| Ottawa | 28.1 /100 | #193 | Fair 47.6% |
| Immigrants | Lebanon | 26.5 /100 | #194 | Fair 47.6% |
| Immigrants | Trinidad and Tobago | 25.3 /100 | #195 | Fair 47.6% |
| Immigrants | Portugal | 23.8 /100 | #196 | Fair 47.6% |
Demographics Similar to Bahamians by Disability Age Over 75
In terms of disability age over 75, the demographic groups most similar to Bahamians are Immigrants from Western Asia (48.0%, a difference of 0.010%), Immigrants from Oceania (48.0%, a difference of 0.010%), Barbadian (48.0%, a difference of 0.050%), Immigrants from Bangladesh (48.0%, a difference of 0.050%), and Liberian (48.0%, a difference of 0.060%).
| Demographics | Rating | Rank | Disability Age Over 75 |
| Laotians | 11.5 /100 | #213 | Poor 47.9% |
| Immigrants | Barbados | 10.7 /100 | #214 | Poor 47.9% |
| Senegalese | 10.7 /100 | #215 | Poor 47.9% |
| Immigrants | Panama | 10.2 /100 | #216 | Poor 47.9% |
| Immigrants | Grenada | 9.4 /100 | #217 | Tragic 47.9% |
| Immigrants | Western Africa | 8.3 /100 | #218 | Tragic 48.0% |
| Immigrants | Western Asia | 7.5 /100 | #219 | Tragic 48.0% |
| Bahamians | 7.4 /100 | #220 | Tragic 48.0% |
| Immigrants | Oceania | 7.3 /100 | #221 | Tragic 48.0% |
| Barbadians | 6.8 /100 | #222 | Tragic 48.0% |
| Immigrants | Bangladesh | 6.8 /100 | #223 | Tragic 48.0% |
| Liberians | 6.7 /100 | #224 | Tragic 48.0% |
| Spanish | 6.5 /100 | #225 | Tragic 48.0% |
| Immigrants | Nonimmigrants | 6.5 /100 | #226 | Tragic 48.0% |
| Zimbabweans | 6.4 /100 | #227 | Tragic 48.1% |