Immigrants from Kenya vs Immigrants from Latin America Disability Age Over 75
COMPARE
Immigrants from Kenya
Immigrants from Latin America
Disability Age Over 75
Disability Age Over 75 Comparison
Immigrants from Kenya
Immigrants from Latin America
47.6%
DISABILITY AGE OVER 75
30.8/ 100
METRIC RATING
189th/ 347
METRIC RANK
49.5%
DISABILITY AGE OVER 75
0.0/ 100
METRIC RATING
284th/ 347
METRIC RANK
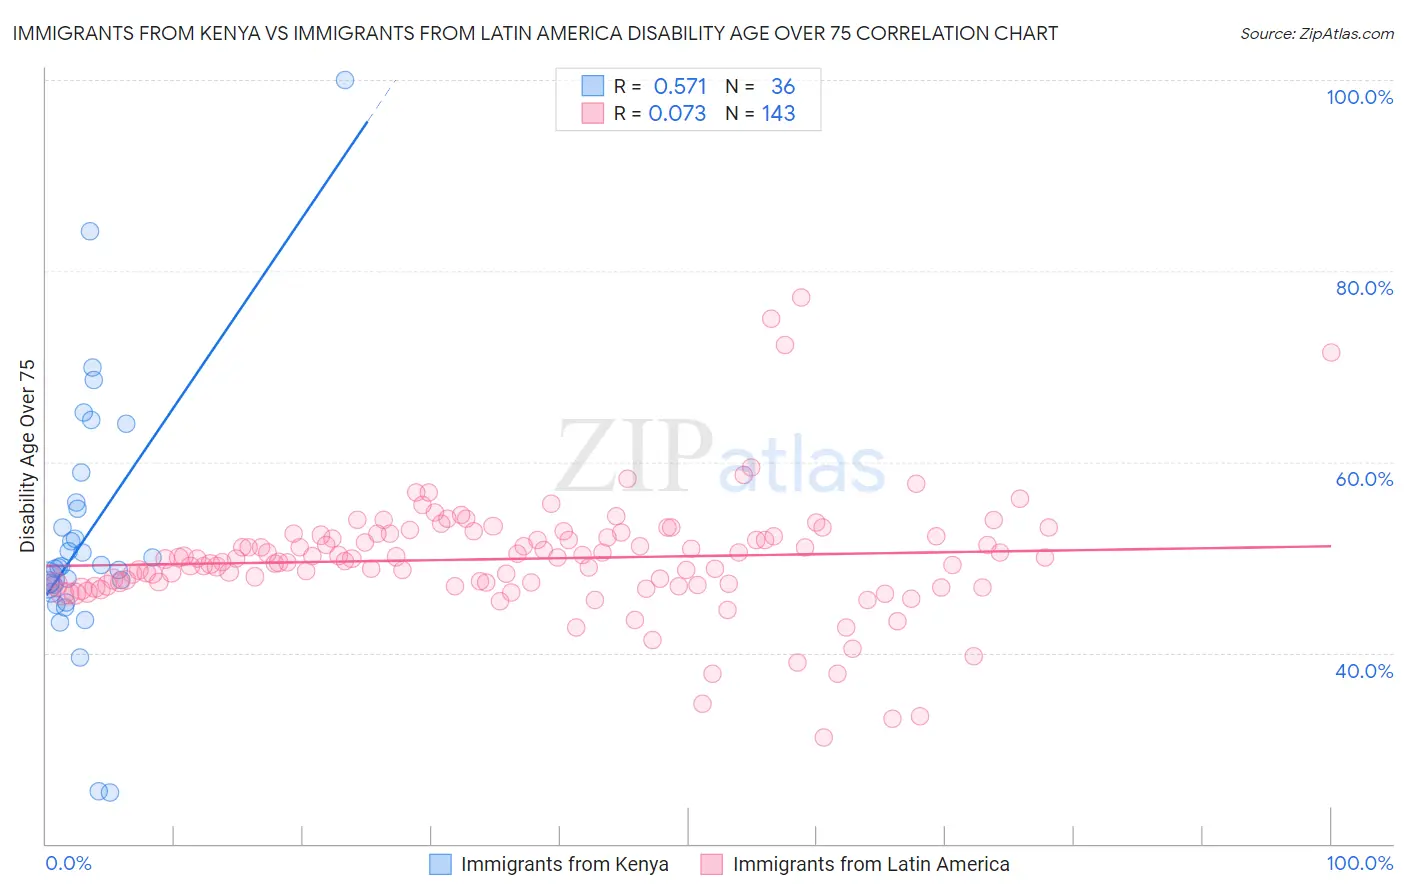
Immigrants from Kenya vs Immigrants from Latin America Disability Age Over 75 Correlation Chart
The statistical analysis conducted on geographies consisting of 217,778,670 people shows a substantial positive correlation between the proportion of Immigrants from Kenya and percentage of population with a disability over the age of 75 in the United States with a correlation coefficient (R) of 0.571 and weighted average of 47.6%. Similarly, the statistical analysis conducted on geographies consisting of 556,620,542 people shows a slight positive correlation between the proportion of Immigrants from Latin America and percentage of population with a disability over the age of 75 in the United States with a correlation coefficient (R) of 0.073 and weighted average of 49.5%, a difference of 4.2%.
Disability Age Over 75 Correlation Summary
| Measurement | Immigrants from Kenya | Immigrants from Latin America |
| Minimum | 25.4% | 31.1% |
| Maximum | 100.0% | 77.2% |
| Range | 74.6% | 46.1% |
| Mean | 52.3% | 49.8% |
| Median | 49.0% | 49.8% |
| Interquartile 25% (IQ1) | 46.7% | 47.2% |
| Interquartile 75% (IQ3) | 55.5% | 52.3% |
| Interquartile Range (IQR) | 8.8% | 5.1% |
| Standard Deviation (Sample) | 13.7% | 6.3% |
| Standard Deviation (Population) | 13.5% | 6.2% |
Similar Demographics by Disability Age Over 75
Demographics Similar to Immigrants from Kenya by Disability Age Over 75
In terms of disability age over 75, the demographic groups most similar to Immigrants from Kenya are Basque (47.6%, a difference of 0.0%), Immigrants from Sudan (47.5%, a difference of 0.020%), Sudanese (47.5%, a difference of 0.030%), Somali (47.6%, a difference of 0.040%), and Portuguese (47.6%, a difference of 0.040%).
| Demographics | Rating | Rank | Disability Age Over 75 |
| Immigrants | Moldova | 39.9 /100 | #182 | Fair 47.4% |
| Delaware | 39.1 /100 | #183 | Fair 47.5% |
| Immigrants | Nigeria | 34.0 /100 | #184 | Fair 47.5% |
| Ghanaians | 33.0 /100 | #185 | Fair 47.5% |
| Sudanese | 32.0 /100 | #186 | Fair 47.5% |
| Immigrants | Sudan | 31.8 /100 | #187 | Fair 47.5% |
| Basques | 30.9 /100 | #188 | Fair 47.6% |
| Immigrants | Kenya | 30.8 /100 | #189 | Fair 47.6% |
| Somalis | 29.5 /100 | #190 | Fair 47.6% |
| Portuguese | 29.3 /100 | #191 | Fair 47.6% |
| Immigrants | Jamaica | 28.3 /100 | #192 | Fair 47.6% |
| Ottawa | 28.1 /100 | #193 | Fair 47.6% |
| Immigrants | Lebanon | 26.5 /100 | #194 | Fair 47.6% |
| Immigrants | Trinidad and Tobago | 25.3 /100 | #195 | Fair 47.6% |
| Immigrants | Portugal | 23.8 /100 | #196 | Fair 47.6% |
Demographics Similar to Immigrants from Latin America by Disability Age Over 75
In terms of disability age over 75, the demographic groups most similar to Immigrants from Latin America are Samoan (49.5%, a difference of 0.050%), Black/African American (49.5%, a difference of 0.080%), Crow (49.6%, a difference of 0.13%), Belizean (49.4%, a difference of 0.22%), and Immigrants from Belize (49.6%, a difference of 0.22%).
| Demographics | Rating | Rank | Disability Age Over 75 |
| Hawaiians | 0.1 /100 | #277 | Tragic 49.2% |
| Immigrants | Laos | 0.1 /100 | #278 | Tragic 49.2% |
| Guamanians/Chamorros | 0.0 /100 | #279 | Tragic 49.4% |
| Bangladeshis | 0.0 /100 | #280 | Tragic 49.4% |
| Belizeans | 0.0 /100 | #281 | Tragic 49.4% |
| Blacks/African Americans | 0.0 /100 | #282 | Tragic 49.5% |
| Samoans | 0.0 /100 | #283 | Tragic 49.5% |
| Immigrants | Latin America | 0.0 /100 | #284 | Tragic 49.5% |
| Crow | 0.0 /100 | #285 | Tragic 49.6% |
| Immigrants | Belize | 0.0 /100 | #286 | Tragic 49.6% |
| Sioux | 0.0 /100 | #287 | Tragic 49.7% |
| Yaqui | 0.0 /100 | #288 | Tragic 49.8% |
| Osage | 0.0 /100 | #289 | Tragic 49.8% |
| Puget Sound Salish | 0.0 /100 | #290 | Tragic 49.8% |
| Arapaho | 0.0 /100 | #291 | Tragic 49.8% |