Immigrants from Kenya vs New Zealander Disability Age Over 75
COMPARE
Immigrants from Kenya
New Zealander
Disability Age Over 75
Disability Age Over 75 Comparison
Immigrants from Kenya
New Zealanders
47.6%
DISABILITY AGE OVER 75
30.8/ 100
METRIC RATING
189th/ 347
METRIC RANK
46.2%
DISABILITY AGE OVER 75
98.8/ 100
METRIC RATING
81st/ 347
METRIC RANK
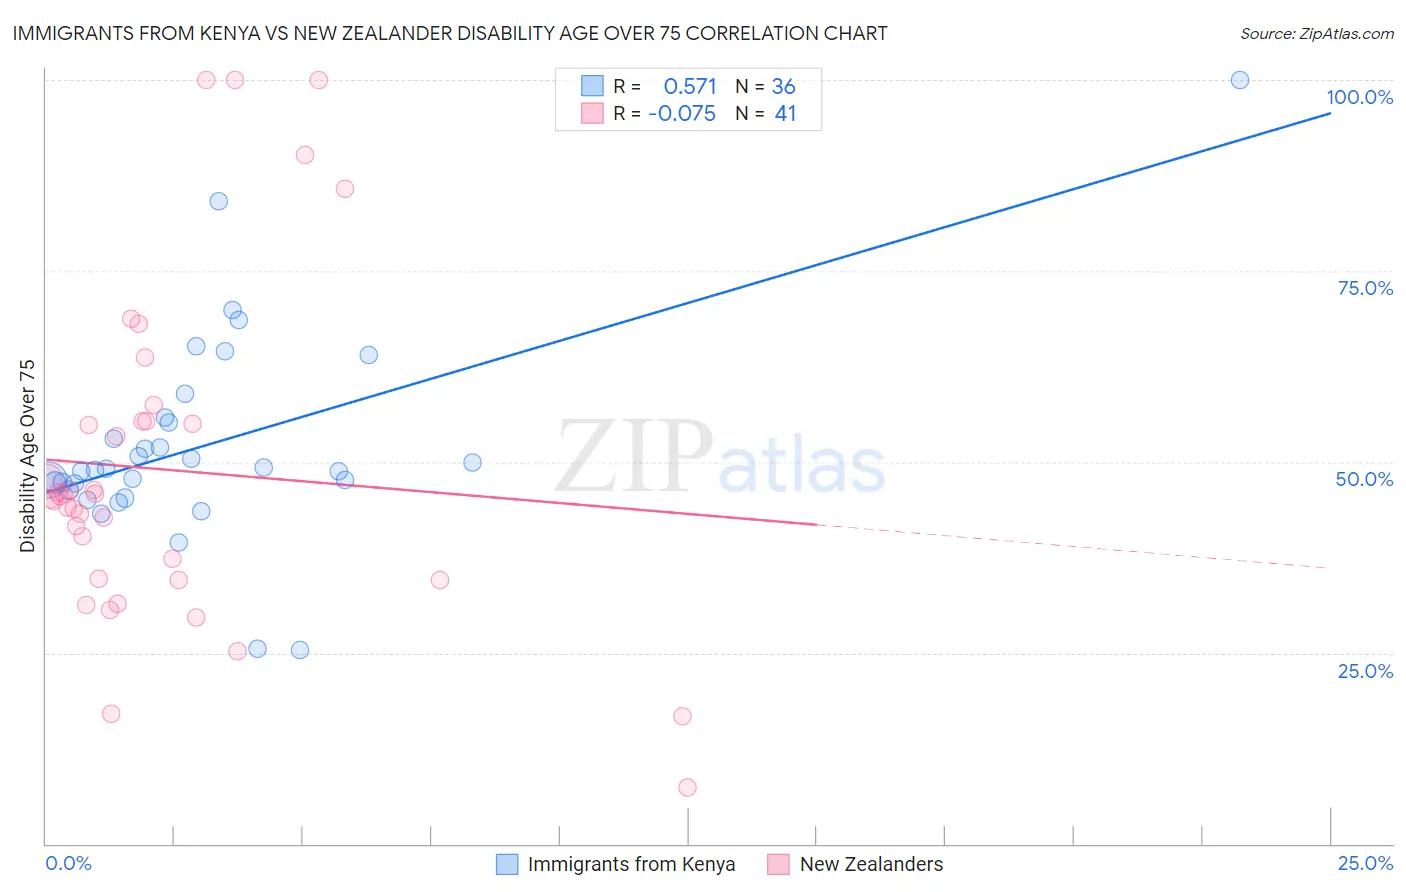
Immigrants from Kenya vs New Zealander Disability Age Over 75 Correlation Chart
The statistical analysis conducted on geographies consisting of 217,778,670 people shows a substantial positive correlation between the proportion of Immigrants from Kenya and percentage of population with a disability over the age of 75 in the United States with a correlation coefficient (R) of 0.571 and weighted average of 47.6%. Similarly, the statistical analysis conducted on geographies consisting of 106,876,595 people shows a slight negative correlation between the proportion of New Zealanders and percentage of population with a disability over the age of 75 in the United States with a correlation coefficient (R) of -0.075 and weighted average of 46.2%, a difference of 3.0%.
Disability Age Over 75 Correlation Summary
| Measurement | Immigrants from Kenya | New Zealander |
| Minimum | 25.4% | 7.4% |
| Maximum | 100.0% | 100.0% |
| Range | 74.6% | 92.6% |
| Mean | 52.3% | 49.0% |
| Median | 49.0% | 45.6% |
| Interquartile 25% (IQ1) | 46.7% | 34.6% |
| Interquartile 75% (IQ3) | 55.5% | 55.3% |
| Interquartile Range (IQR) | 8.8% | 20.7% |
| Standard Deviation (Sample) | 13.7% | 21.7% |
| Standard Deviation (Population) | 13.5% | 21.5% |
Similar Demographics by Disability Age Over 75
Demographics Similar to Immigrants from Kenya by Disability Age Over 75
In terms of disability age over 75, the demographic groups most similar to Immigrants from Kenya are Basque (47.6%, a difference of 0.0%), Immigrants from Sudan (47.5%, a difference of 0.020%), Sudanese (47.5%, a difference of 0.030%), Somali (47.6%, a difference of 0.040%), and Portuguese (47.6%, a difference of 0.040%).
| Demographics | Rating | Rank | Disability Age Over 75 |
| Immigrants | Moldova | 39.9 /100 | #182 | Fair 47.4% |
| Delaware | 39.1 /100 | #183 | Fair 47.5% |
| Immigrants | Nigeria | 34.0 /100 | #184 | Fair 47.5% |
| Ghanaians | 33.0 /100 | #185 | Fair 47.5% |
| Sudanese | 32.0 /100 | #186 | Fair 47.5% |
| Immigrants | Sudan | 31.8 /100 | #187 | Fair 47.5% |
| Basques | 30.9 /100 | #188 | Fair 47.6% |
| Immigrants | Kenya | 30.8 /100 | #189 | Fair 47.6% |
| Somalis | 29.5 /100 | #190 | Fair 47.6% |
| Portuguese | 29.3 /100 | #191 | Fair 47.6% |
| Immigrants | Jamaica | 28.3 /100 | #192 | Fair 47.6% |
| Ottawa | 28.1 /100 | #193 | Fair 47.6% |
| Immigrants | Lebanon | 26.5 /100 | #194 | Fair 47.6% |
| Immigrants | Trinidad and Tobago | 25.3 /100 | #195 | Fair 47.6% |
| Immigrants | Portugal | 23.8 /100 | #196 | Fair 47.6% |
Demographics Similar to New Zealanders by Disability Age Over 75
In terms of disability age over 75, the demographic groups most similar to New Zealanders are Soviet Union (46.2%, a difference of 0.0%), Swiss (46.2%, a difference of 0.010%), Immigrants from Latvia (46.2%, a difference of 0.020%), Argentinean (46.2%, a difference of 0.020%), and Immigrants from Jordan (46.2%, a difference of 0.030%).
| Demographics | Rating | Rank | Disability Age Over 75 |
| Egyptians | 99.0 /100 | #74 | Exceptional 46.1% |
| Serbians | 99.0 /100 | #75 | Exceptional 46.1% |
| Slavs | 98.9 /100 | #76 | Exceptional 46.1% |
| Immigrants | Eastern Asia | 98.9 /100 | #77 | Exceptional 46.2% |
| Immigrants | Western Europe | 98.8 /100 | #78 | Exceptional 46.2% |
| Swiss | 98.8 /100 | #79 | Exceptional 46.2% |
| Soviet Union | 98.8 /100 | #80 | Exceptional 46.2% |
| New Zealanders | 98.8 /100 | #81 | Exceptional 46.2% |
| Immigrants | Latvia | 98.7 /100 | #82 | Exceptional 46.2% |
| Argentineans | 98.7 /100 | #83 | Exceptional 46.2% |
| Immigrants | Jordan | 98.7 /100 | #84 | Exceptional 46.2% |
| Immigrants | Southern Europe | 98.6 /100 | #85 | Exceptional 46.2% |
| Romanians | 98.6 /100 | #86 | Exceptional 46.2% |
| Danes | 98.6 /100 | #87 | Exceptional 46.2% |
| Uruguayans | 98.4 /100 | #88 | Exceptional 46.2% |