Immigrants from Kenya vs Chickasaw Female Disability
COMPARE
Immigrants from Kenya
Chickasaw
Female Disability
Female Disability Comparison
Immigrants from Kenya
Chickasaw
12.0%
FEMALE DISABILITY
83.1/ 100
METRIC RATING
148th/ 347
METRIC RANK
15.2%
FEMALE DISABILITY
0.0/ 100
METRIC RATING
340th/ 347
METRIC RANK
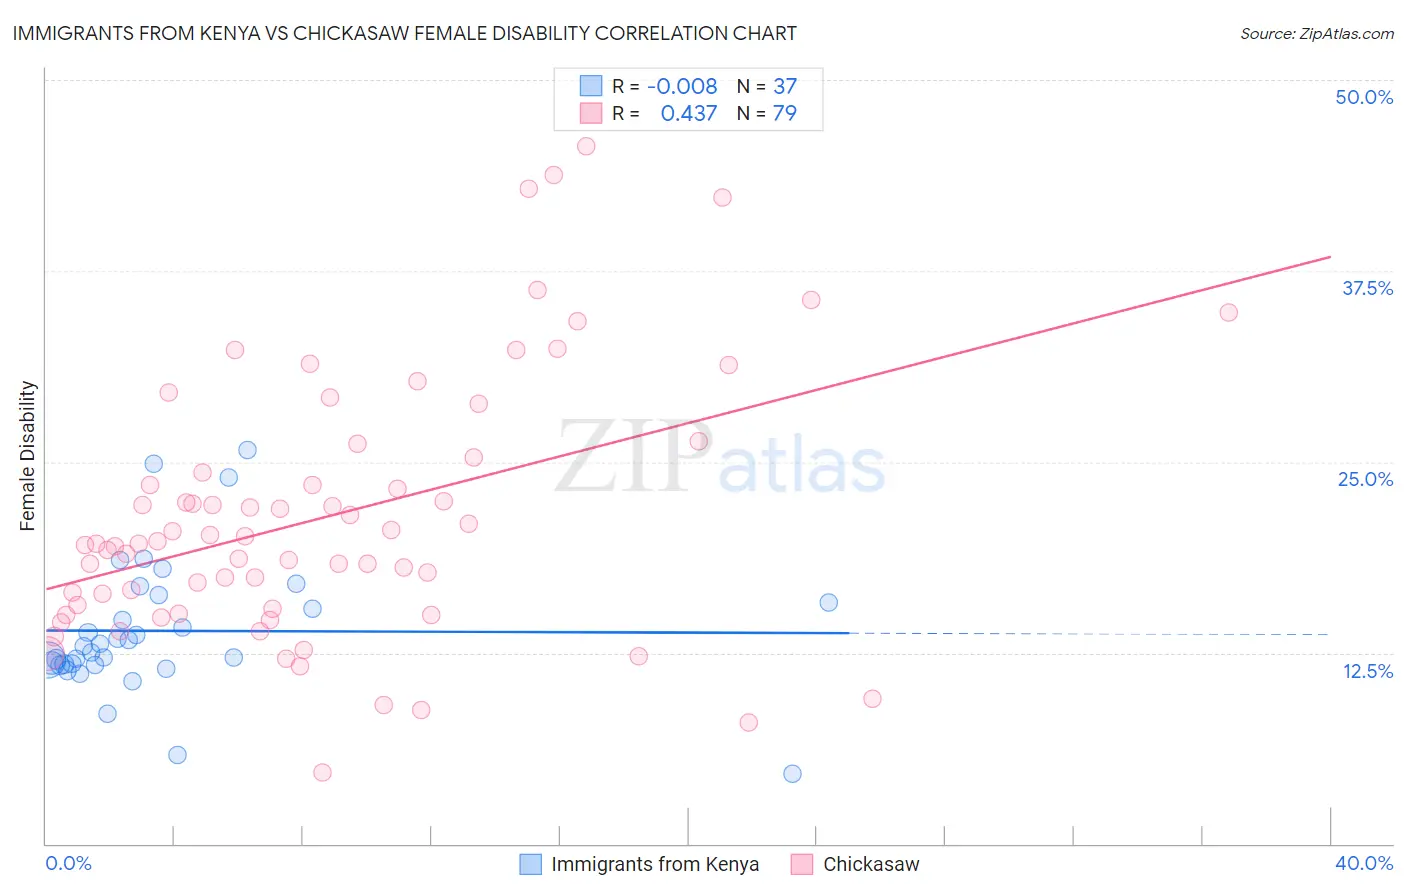
Immigrants from Kenya vs Chickasaw Female Disability Correlation Chart
The statistical analysis conducted on geographies consisting of 218,056,987 people shows no correlation between the proportion of Immigrants from Kenya and percentage of females with a disability in the United States with a correlation coefficient (R) of -0.008 and weighted average of 12.0%. Similarly, the statistical analysis conducted on geographies consisting of 147,688,443 people shows a moderate positive correlation between the proportion of Chickasaw and percentage of females with a disability in the United States with a correlation coefficient (R) of 0.437 and weighted average of 15.2%, a difference of 26.6%.
Female Disability Correlation Summary
| Measurement | Immigrants from Kenya | Chickasaw |
| Minimum | 4.5% | 4.7% |
| Maximum | 25.8% | 45.6% |
| Range | 21.2% | 41.0% |
| Mean | 13.9% | 21.5% |
| Median | 12.9% | 19.7% |
| Interquartile 25% (IQ1) | 11.7% | 15.4% |
| Interquartile 75% (IQ3) | 16.1% | 25.3% |
| Interquartile Range (IQR) | 4.3% | 9.8% |
| Standard Deviation (Sample) | 4.4% | 8.6% |
| Standard Deviation (Population) | 4.4% | 8.5% |
Similar Demographics by Female Disability
Demographics Similar to Immigrants from Kenya by Female Disability
In terms of female disability, the demographic groups most similar to Immigrants from Kenya are Nigerian (12.0%, a difference of 0.070%), Greek (12.0%, a difference of 0.070%), Pakistani (12.0%, a difference of 0.11%), Immigrants from Moldova (12.0%, a difference of 0.11%), and Icelander (12.0%, a difference of 0.15%).
| Demographics | Rating | Rank | Female Disability |
| Immigrants | Ecuador | 91.5 /100 | #141 | Exceptional 11.9% |
| Immigrants | Africa | 90.0 /100 | #142 | Excellent 11.9% |
| Immigrants | Sudan | 89.6 /100 | #143 | Excellent 11.9% |
| Immigrants | Austria | 87.9 /100 | #144 | Excellent 12.0% |
| Estonians | 87.8 /100 | #145 | Excellent 12.0% |
| Pakistanis | 84.6 /100 | #146 | Excellent 12.0% |
| Nigerians | 84.0 /100 | #147 | Excellent 12.0% |
| Immigrants | Kenya | 83.1 /100 | #148 | Excellent 12.0% |
| Greeks | 82.0 /100 | #149 | Excellent 12.0% |
| Immigrants | Moldova | 81.4 /100 | #150 | Excellent 12.0% |
| Icelanders | 80.7 /100 | #151 | Excellent 12.0% |
| Immigrants | Scotland | 79.3 /100 | #152 | Good 12.0% |
| Sudanese | 79.1 /100 | #153 | Good 12.0% |
| Syrians | 76.9 /100 | #154 | Good 12.1% |
| Ghanaians | 76.6 /100 | #155 | Good 12.1% |
Demographics Similar to Chickasaw by Female Disability
In terms of female disability, the demographic groups most similar to Chickasaw are Colville (15.1%, a difference of 0.95%), Dutch West Indian (15.0%, a difference of 1.4%), Choctaw (15.4%, a difference of 1.4%), Tohono O'odham (15.0%, a difference of 1.5%), and Seminole (15.0%, a difference of 1.6%).
| Demographics | Rating | Rank | Female Disability |
| Immigrants | Azores | 0.0 /100 | #333 | Tragic 14.9% |
| Cherokee | 0.0 /100 | #334 | Tragic 14.9% |
| Cajuns | 0.0 /100 | #335 | Tragic 14.9% |
| Seminole | 0.0 /100 | #336 | Tragic 15.0% |
| Tohono O'odham | 0.0 /100 | #337 | Tragic 15.0% |
| Dutch West Indians | 0.0 /100 | #338 | Tragic 15.0% |
| Colville | 0.0 /100 | #339 | Tragic 15.1% |
| Chickasaw | 0.0 /100 | #340 | Tragic 15.2% |
| Choctaw | 0.0 /100 | #341 | Tragic 15.4% |
| Creek | 0.0 /100 | #342 | Tragic 15.7% |
| Lumbee | 0.0 /100 | #343 | Tragic 15.8% |
| Kiowa | 0.0 /100 | #344 | Tragic 15.8% |
| Puerto Ricans | 0.0 /100 | #345 | Tragic 16.6% |
| Tsimshian | 0.0 /100 | #346 | Tragic 16.8% |
| Houma | 0.0 /100 | #347 | Tragic 16.9% |