Immigrants from Kenya vs Lithuanian Female Disability
COMPARE
Immigrants from Kenya
Lithuanian
Female Disability
Female Disability Comparison
Immigrants from Kenya
Lithuanians
12.0%
FEMALE DISABILITY
83.1/ 100
METRIC RATING
148th/ 347
METRIC RANK
12.2%
FEMALE DISABILITY
59.5/ 100
METRIC RATING
166th/ 347
METRIC RANK
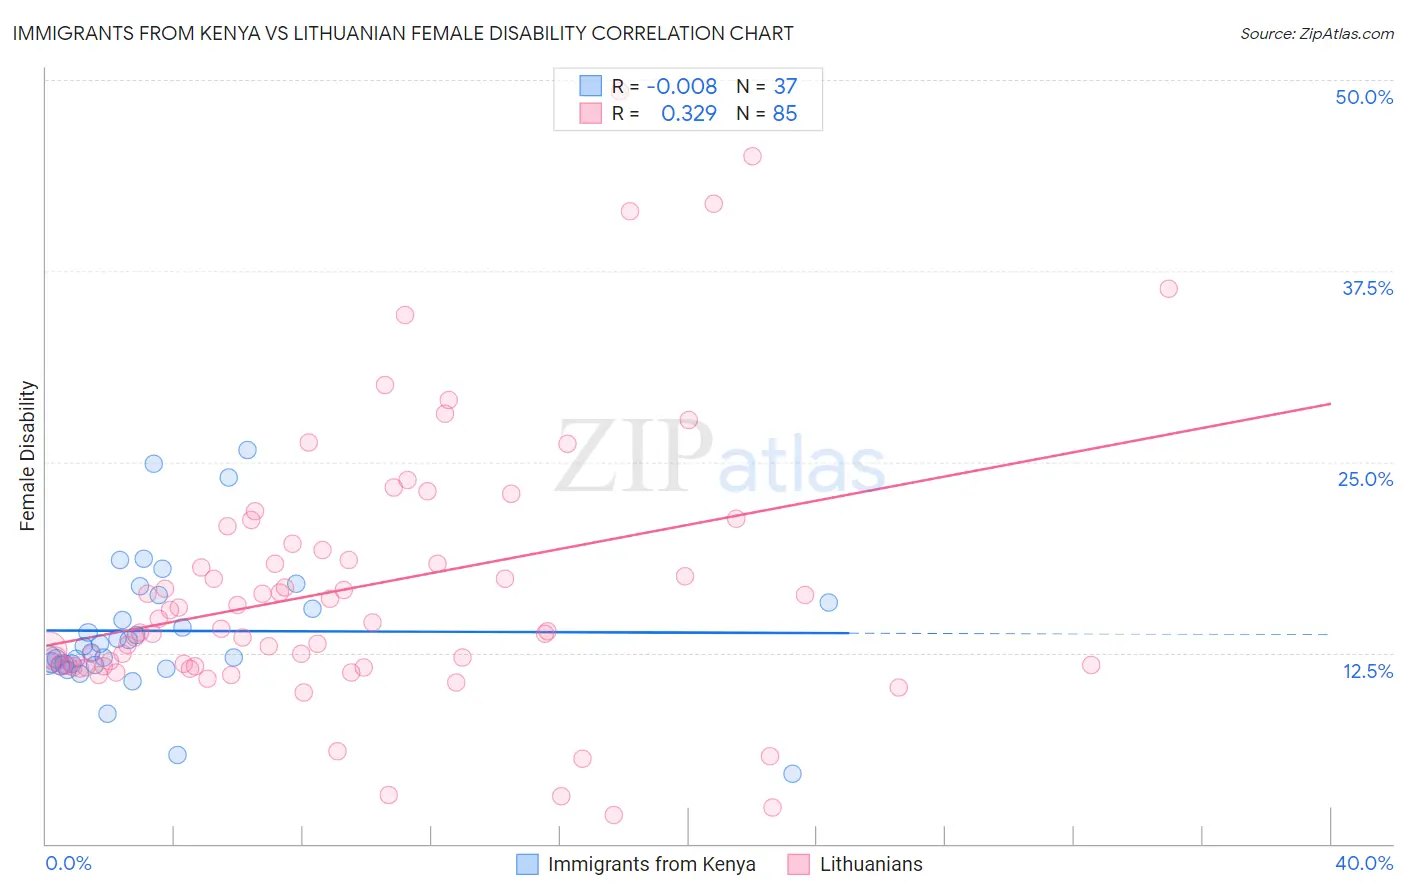
Immigrants from Kenya vs Lithuanian Female Disability Correlation Chart
The statistical analysis conducted on geographies consisting of 218,056,987 people shows no correlation between the proportion of Immigrants from Kenya and percentage of females with a disability in the United States with a correlation coefficient (R) of -0.008 and weighted average of 12.0%. Similarly, the statistical analysis conducted on geographies consisting of 421,926,295 people shows a mild positive correlation between the proportion of Lithuanians and percentage of females with a disability in the United States with a correlation coefficient (R) of 0.329 and weighted average of 12.2%, a difference of 1.1%.
Female Disability Correlation Summary
| Measurement | Immigrants from Kenya | Lithuanian |
| Minimum | 4.5% | 1.9% |
| Maximum | 25.8% | 49.2% |
| Range | 21.2% | 47.3% |
| Mean | 13.9% | 16.8% |
| Median | 12.9% | 14.0% |
| Interquartile 25% (IQ1) | 11.7% | 11.6% |
| Interquartile 75% (IQ3) | 16.1% | 19.4% |
| Interquartile Range (IQR) | 4.3% | 7.8% |
| Standard Deviation (Sample) | 4.4% | 9.0% |
| Standard Deviation (Population) | 4.4% | 9.0% |
Demographics Similar to Immigrants from Kenya and Lithuanians by Female Disability
In terms of female disability, the demographic groups most similar to Immigrants from Kenya are Nigerian (12.0%, a difference of 0.070%), Greek (12.0%, a difference of 0.070%), Immigrants from Moldova (12.0%, a difference of 0.11%), Icelander (12.0%, a difference of 0.15%), and Immigrants from Scotland (12.0%, a difference of 0.24%). Similarly, the demographic groups most similar to Lithuanians are Immigrants from Latin America (12.2%, a difference of 0.020%), Immigrants from Oceania (12.1%, a difference of 0.090%), Czech (12.1%, a difference of 0.17%), Guatemalan (12.1%, a difference of 0.18%), and Immigrants from Ukraine (12.1%, a difference of 0.20%).
| Demographics | Rating | Rank | Female Disability |
| Nigerians | 84.0 /100 | #147 | Excellent 12.0% |
| Immigrants | Kenya | 83.1 /100 | #148 | Excellent 12.0% |
| Greeks | 82.0 /100 | #149 | Excellent 12.0% |
| Immigrants | Moldova | 81.4 /100 | #150 | Excellent 12.0% |
| Icelanders | 80.7 /100 | #151 | Excellent 12.0% |
| Immigrants | Scotland | 79.3 /100 | #152 | Good 12.0% |
| Sudanese | 79.1 /100 | #153 | Good 12.0% |
| Syrians | 76.9 /100 | #154 | Good 12.1% |
| Ghanaians | 76.6 /100 | #155 | Good 12.1% |
| Moroccans | 72.9 /100 | #156 | Good 12.1% |
| Danes | 72.5 /100 | #157 | Good 12.1% |
| Immigrants | Middle Africa | 72.4 /100 | #158 | Good 12.1% |
| Immigrants | Central America | 67.7 /100 | #159 | Good 12.1% |
| Immigrants | Guatemala | 66.0 /100 | #160 | Good 12.1% |
| Guyanese | 64.7 /100 | #161 | Good 12.1% |
| Immigrants | Ukraine | 64.3 /100 | #162 | Good 12.1% |
| Guatemalans | 63.8 /100 | #163 | Good 12.1% |
| Czechs | 63.6 /100 | #164 | Good 12.1% |
| Immigrants | Oceania | 61.8 /100 | #165 | Good 12.1% |
| Lithuanians | 59.5 /100 | #166 | Average 12.2% |
| Immigrants | Latin America | 59.0 /100 | #167 | Average 12.2% |