Immigrants from Kenya vs Chickasaw Householder Income Ages 25 - 44 years
COMPARE
Immigrants from Kenya
Chickasaw
Householder Income Ages 25 - 44 years
Householder Income Ages 25 - 44 years Comparison
Immigrants from Kenya
Chickasaw
$90,767
HOUSEHOLDER INCOME AGES 25 - 44 YEARS
10.9/ 100
METRIC RATING
210th/ 347
METRIC RANK
$77,929
HOUSEHOLDER INCOME AGES 25 - 44 YEARS
0.0/ 100
METRIC RATING
322nd/ 347
METRIC RANK
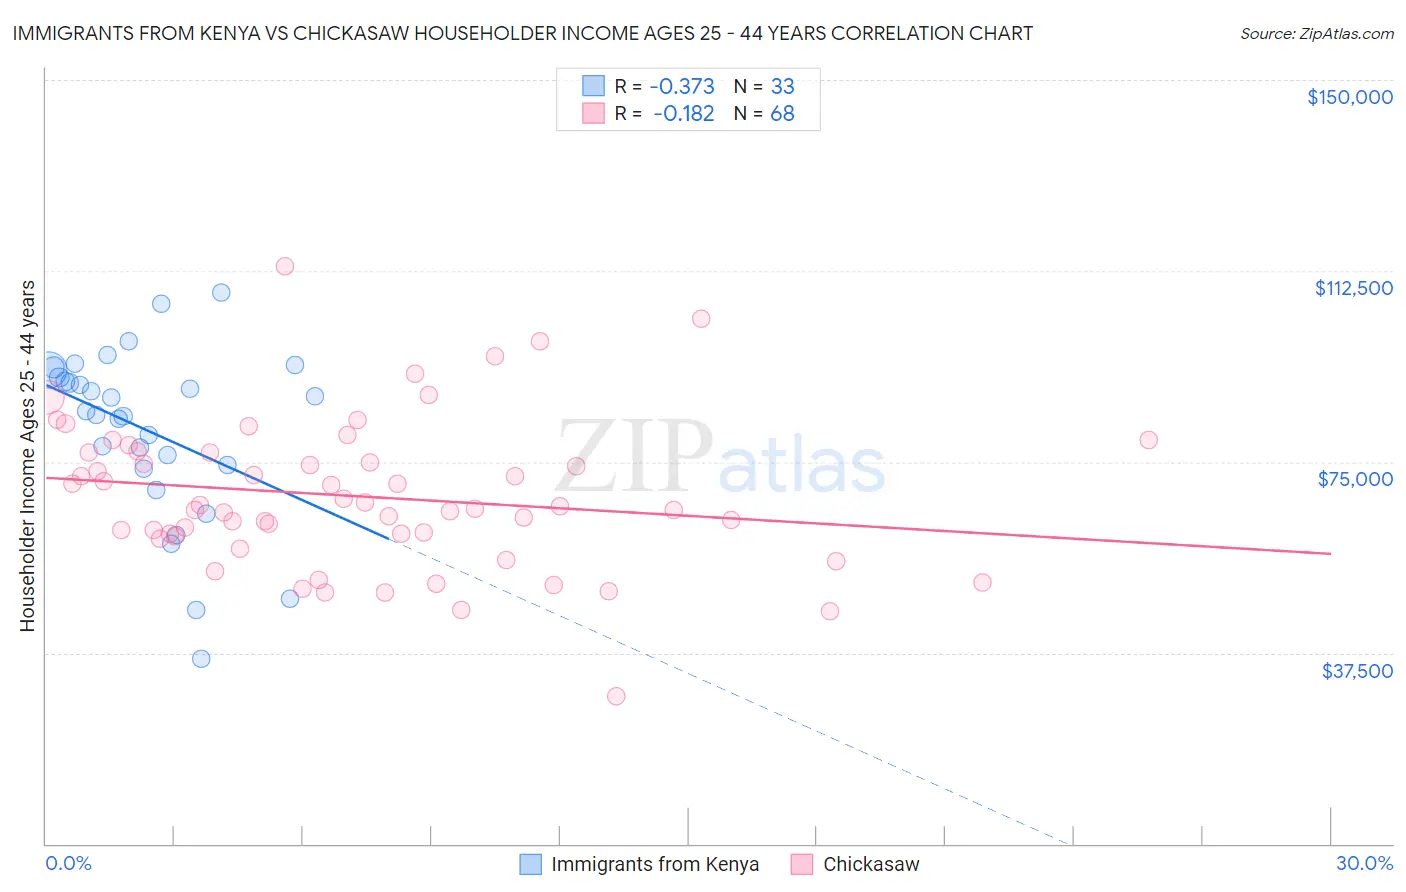
Immigrants from Kenya vs Chickasaw Householder Income Ages 25 - 44 years Correlation Chart
The statistical analysis conducted on geographies consisting of 217,833,314 people shows a mild negative correlation between the proportion of Immigrants from Kenya and household income with householder between the ages 25 and 44 in the United States with a correlation coefficient (R) of -0.373 and weighted average of $90,767. Similarly, the statistical analysis conducted on geographies consisting of 147,542,278 people shows a poor negative correlation between the proportion of Chickasaw and household income with householder between the ages 25 and 44 in the United States with a correlation coefficient (R) of -0.182 and weighted average of $77,929, a difference of 16.5%.
Householder Income Ages 25 - 44 years Correlation Summary
| Measurement | Immigrants from Kenya | Chickasaw |
| Minimum | $36,409 | $29,071 |
| Maximum | $108,304 | $113,361 |
| Range | $71,895 | $84,290 |
| Mean | $81,270 | $68,238 |
| Median | $85,004 | $66,121 |
| Interquartile 25% (IQ1) | $73,989 | $60,623 |
| Interquartile 75% (IQ3) | $92,370 | $76,882 |
| Interquartile Range (IQR) | $18,381 | $16,259 |
| Standard Deviation (Sample) | $16,718 | $14,676 |
| Standard Deviation (Population) | $16,463 | $14,567 |
Similar Demographics by Householder Income Ages 25 - 44 years
Demographics Similar to Immigrants from Kenya by Householder Income Ages 25 - 44 years
In terms of householder income ages 25 - 44 years, the demographic groups most similar to Immigrants from Kenya are Iraqi ($90,764, a difference of 0.0%), Hawaiian ($90,722, a difference of 0.050%), Immigrants from Bangladesh ($90,448, a difference of 0.35%), Immigrants from Africa ($90,372, a difference of 0.44%), and Immigrants from Uruguay ($91,171, a difference of 0.45%).
| Demographics | Rating | Rank | Householder Income Ages 25 - 44 years |
| Immigrants | Cambodia | 15.7 /100 | #203 | Poor $91,533 |
| Nepalese | 15.4 /100 | #204 | Poor $91,498 |
| Immigrants | Eastern Africa | 15.2 /100 | #205 | Poor $91,458 |
| Aleuts | 14.5 /100 | #206 | Poor $91,370 |
| Yugoslavians | 14.5 /100 | #207 | Poor $91,368 |
| Immigrants | Thailand | 14.3 /100 | #208 | Poor $91,337 |
| Immigrants | Uruguay | 13.2 /100 | #209 | Poor $91,171 |
| Immigrants | Kenya | 10.9 /100 | #210 | Poor $90,767 |
| Iraqis | 10.8 /100 | #211 | Poor $90,764 |
| Hawaiians | 10.6 /100 | #212 | Poor $90,722 |
| Immigrants | Bangladesh | 9.3 /100 | #213 | Tragic $90,448 |
| Immigrants | Africa | 8.9 /100 | #214 | Tragic $90,372 |
| Panamanians | 8.1 /100 | #215 | Tragic $90,193 |
| Ghanaians | 7.9 /100 | #216 | Tragic $90,137 |
| Scotch-Irish | 7.3 /100 | #217 | Tragic $89,969 |
Demographics Similar to Chickasaw by Householder Income Ages 25 - 44 years
In terms of householder income ages 25 - 44 years, the demographic groups most similar to Chickasaw are Immigrants from Zaire ($78,045, a difference of 0.15%), Choctaw ($78,168, a difference of 0.31%), Honduran ($78,540, a difference of 0.78%), Immigrants from Honduras ($77,328, a difference of 0.78%), and Dutch West Indian ($77,260, a difference of 0.87%).
| Demographics | Rating | Rank | Householder Income Ages 25 - 44 years |
| Ottawa | 0.0 /100 | #315 | Tragic $79,012 |
| Africans | 0.0 /100 | #316 | Tragic $78,986 |
| U.S. Virgin Islanders | 0.0 /100 | #317 | Tragic $78,911 |
| Immigrants | Mexico | 0.0 /100 | #318 | Tragic $78,809 |
| Hondurans | 0.0 /100 | #319 | Tragic $78,540 |
| Choctaw | 0.0 /100 | #320 | Tragic $78,168 |
| Immigrants | Zaire | 0.0 /100 | #321 | Tragic $78,045 |
| Chickasaw | 0.0 /100 | #322 | Tragic $77,929 |
| Immigrants | Honduras | 0.0 /100 | #323 | Tragic $77,328 |
| Dutch West Indians | 0.0 /100 | #324 | Tragic $77,260 |
| Sioux | 0.0 /100 | #325 | Tragic $77,089 |
| Houma | 0.0 /100 | #326 | Tragic $77,044 |
| Immigrants | Bahamas | 0.0 /100 | #327 | Tragic $76,910 |
| Immigrants | Cuba | 0.0 /100 | #328 | Tragic $76,701 |
| Seminole | 0.0 /100 | #329 | Tragic $76,584 |