Immigrants from Kazakhstan vs Luxembourger Cognitive Disability
COMPARE
Immigrants from Kazakhstan
Luxembourger
Cognitive Disability
Cognitive Disability Comparison
Immigrants from Kazakhstan
Luxembourgers
17.1%
COGNITIVE DISABILITY
80.5/ 100
METRIC RATING
153rd/ 347
METRIC RANK
16.4%
COGNITIVE DISABILITY
99.9/ 100
METRIC RATING
25th/ 347
METRIC RANK
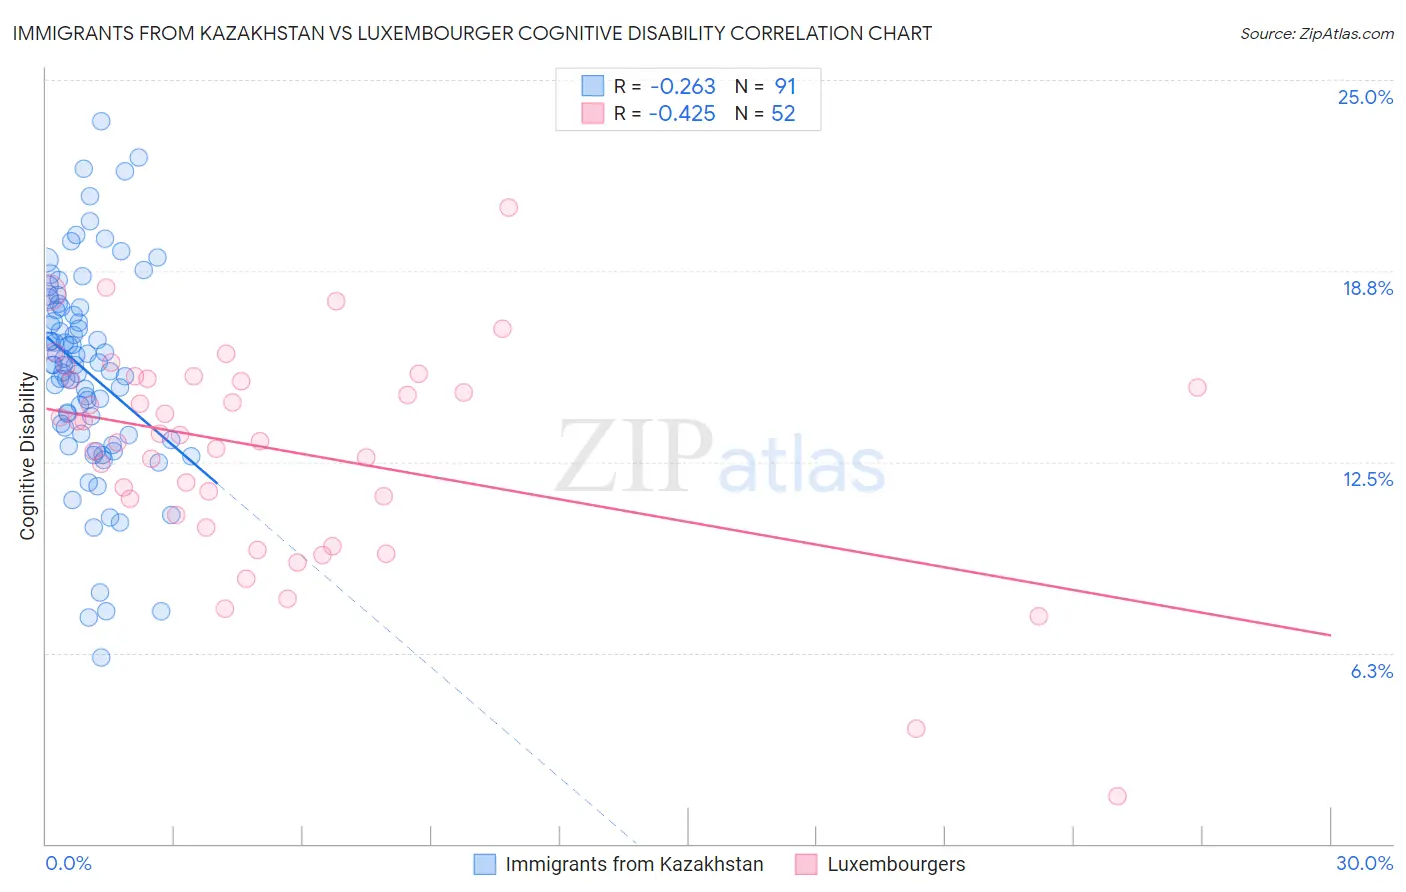
Immigrants from Kazakhstan vs Luxembourger Cognitive Disability Correlation Chart
The statistical analysis conducted on geographies consisting of 124,443,744 people shows a weak negative correlation between the proportion of Immigrants from Kazakhstan and percentage of population with cognitive disability in the United States with a correlation coefficient (R) of -0.263 and weighted average of 17.1%. Similarly, the statistical analysis conducted on geographies consisting of 144,680,571 people shows a moderate negative correlation between the proportion of Luxembourgers and percentage of population with cognitive disability in the United States with a correlation coefficient (R) of -0.425 and weighted average of 16.4%, a difference of 4.4%.
Cognitive Disability Correlation Summary
| Measurement | Immigrants from Kazakhstan | Luxembourger |
| Minimum | 6.1% | 1.6% |
| Maximum | 23.7% | 20.8% |
| Range | 17.6% | 19.3% |
| Mean | 15.5% | 12.9% |
| Median | 15.7% | 13.4% |
| Interquartile 25% (IQ1) | 13.4% | 11.0% |
| Interquartile 75% (IQ3) | 17.5% | 15.2% |
| Interquartile Range (IQR) | 4.2% | 4.2% |
| Standard Deviation (Sample) | 3.4% | 3.5% |
| Standard Deviation (Population) | 3.4% | 3.5% |
Similar Demographics by Cognitive Disability
Demographics Similar to Immigrants from Kazakhstan by Cognitive Disability
In terms of cognitive disability, the demographic groups most similar to Immigrants from Kazakhstan are Immigrants from Malaysia (17.1%, a difference of 0.050%), Brazilian (17.1%, a difference of 0.070%), Sri Lankan (17.1%, a difference of 0.070%), Immigrants from Indonesia (17.1%, a difference of 0.10%), and Syrian (17.1%, a difference of 0.12%).
| Demographics | Rating | Rank | Cognitive Disability |
| Costa Ricans | 88.0 /100 | #146 | Excellent 17.0% |
| Scotch-Irish | 85.9 /100 | #147 | Excellent 17.1% |
| French Canadians | 85.7 /100 | #148 | Excellent 17.1% |
| Cypriots | 85.7 /100 | #149 | Excellent 17.1% |
| Basques | 85.5 /100 | #150 | Excellent 17.1% |
| Syrians | 83.0 /100 | #151 | Excellent 17.1% |
| Immigrants | Indonesia | 82.7 /100 | #152 | Excellent 17.1% |
| Immigrants | Kazakhstan | 80.5 /100 | #153 | Excellent 17.1% |
| Immigrants | Malaysia | 79.3 /100 | #154 | Good 17.1% |
| Brazilians | 78.9 /100 | #155 | Good 17.1% |
| Sri Lankans | 78.9 /100 | #156 | Good 17.1% |
| Immigrants | Australia | 76.0 /100 | #157 | Good 17.1% |
| Celtics | 74.1 /100 | #158 | Good 17.1% |
| Immigrants | Latvia | 73.2 /100 | #159 | Good 17.2% |
| Australians | 72.4 /100 | #160 | Good 17.2% |
Demographics Similar to Luxembourgers by Cognitive Disability
In terms of cognitive disability, the demographic groups most similar to Luxembourgers are Immigrants from Croatia (16.4%, a difference of 0.030%), Immigrants from Argentina (16.4%, a difference of 0.040%), Immigrants from Pakistan (16.4%, a difference of 0.050%), Polish (16.4%, a difference of 0.050%), and Croatian (16.4%, a difference of 0.060%).
| Demographics | Rating | Rank | Cognitive Disability |
| Immigrants | Northern Europe | 100.0 /100 | #18 | Exceptional 16.3% |
| Immigrants | Bolivia | 100.0 /100 | #19 | Exceptional 16.3% |
| Bulgarians | 100.0 /100 | #20 | Exceptional 16.3% |
| Immigrants | Cuba | 100.0 /100 | #21 | Exceptional 16.3% |
| Immigrants | South Central Asia | 99.9 /100 | #22 | Exceptional 16.4% |
| Croatians | 99.9 /100 | #23 | Exceptional 16.4% |
| Immigrants | Argentina | 99.9 /100 | #24 | Exceptional 16.4% |
| Luxembourgers | 99.9 /100 | #25 | Exceptional 16.4% |
| Immigrants | Croatia | 99.9 /100 | #26 | Exceptional 16.4% |
| Immigrants | Pakistan | 99.9 /100 | #27 | Exceptional 16.4% |
| Poles | 99.9 /100 | #28 | Exceptional 16.4% |
| Filipinos | 99.9 /100 | #29 | Exceptional 16.4% |
| Czechs | 99.9 /100 | #30 | Exceptional 16.4% |
| Immigrants | Romania | 99.9 /100 | #31 | Exceptional 16.4% |
| Immigrants | Israel | 99.9 /100 | #32 | Exceptional 16.4% |