Immigrants from Japan vs American Disability
COMPARE
Immigrants from Japan
American
Disability
Disability Comparison
Immigrants from Japan
Americans
10.8%
DISABILITY
99.9/ 100
METRIC RATING
44th/ 347
METRIC RANK
13.9%
DISABILITY
0.0/ 100
METRIC RATING
322nd/ 347
METRIC RANK
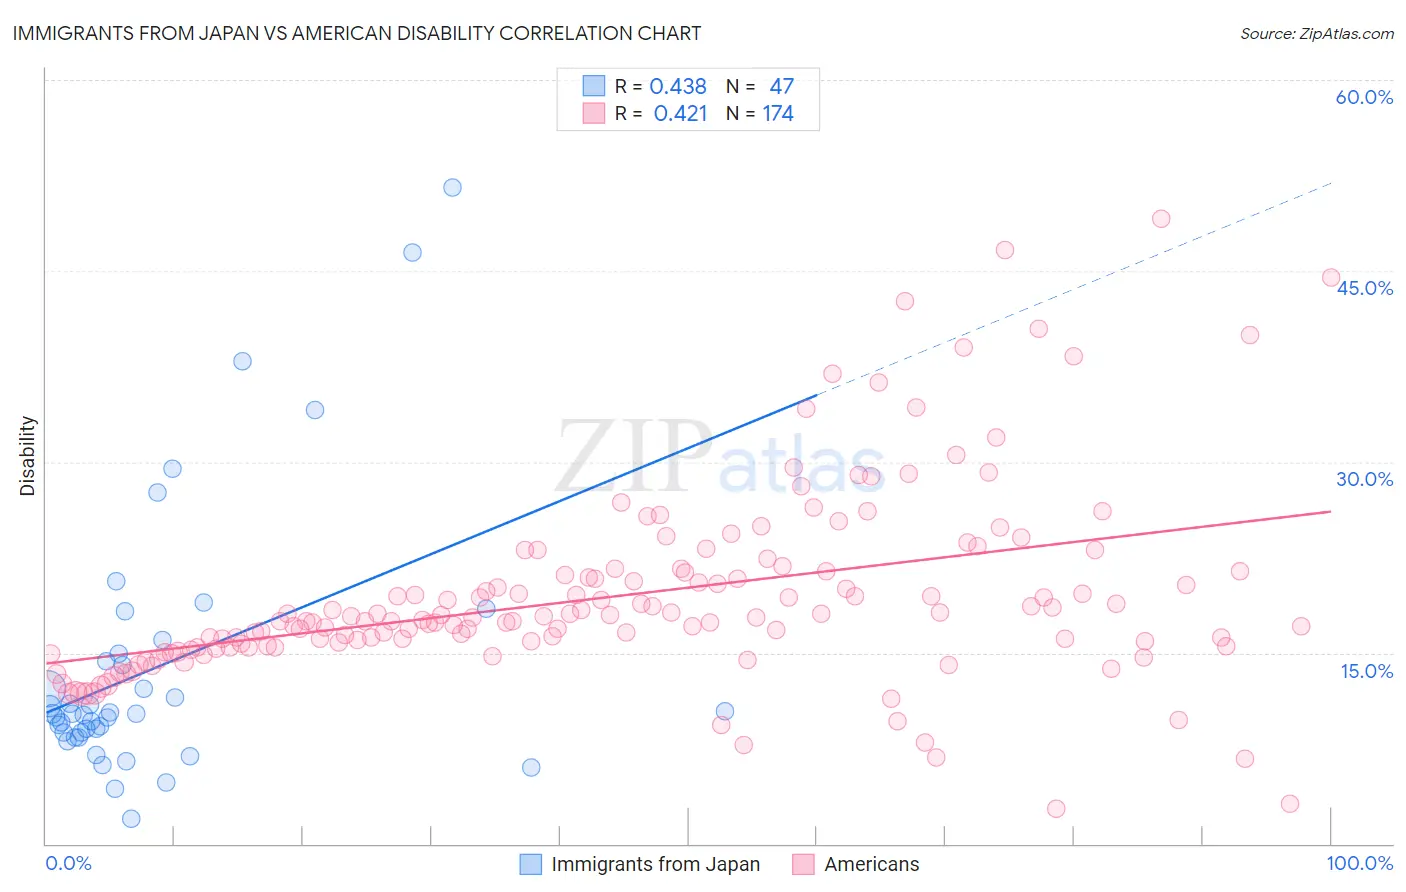
Immigrants from Japan vs American Disability Correlation Chart
The statistical analysis conducted on geographies consisting of 340,149,948 people shows a moderate positive correlation between the proportion of Immigrants from Japan and percentage of population with a disability in the United States with a correlation coefficient (R) of 0.438 and weighted average of 10.8%. Similarly, the statistical analysis conducted on geographies consisting of 581,794,262 people shows a moderate positive correlation between the proportion of Americans and percentage of population with a disability in the United States with a correlation coefficient (R) of 0.421 and weighted average of 13.9%, a difference of 29.0%.
Disability Correlation Summary
| Measurement | Immigrants from Japan | American |
| Minimum | 2.0% | 2.8% |
| Maximum | 51.5% | 49.1% |
| Range | 49.5% | 46.3% |
| Mean | 13.9% | 19.4% |
| Median | 10.2% | 17.7% |
| Interquartile 25% (IQ1) | 8.7% | 15.4% |
| Interquartile 75% (IQ3) | 14.9% | 21.4% |
| Interquartile Range (IQR) | 6.2% | 6.0% |
| Standard Deviation (Sample) | 10.5% | 7.5% |
| Standard Deviation (Population) | 10.3% | 7.5% |
Similar Demographics by Disability
Demographics Similar to Immigrants from Japan by Disability
In terms of disability, the demographic groups most similar to Immigrants from Japan are Israeli (10.8%, a difference of 0.10%), Immigrants from Nepal (10.8%, a difference of 0.15%), Immigrants from Australia (10.8%, a difference of 0.25%), Cambodian (10.8%, a difference of 0.29%), and Mongolian (10.8%, a difference of 0.29%).
| Demographics | Rating | Rank | Disability |
| Turks | 100.0 /100 | #37 | Exceptional 10.7% |
| Afghans | 99.9 /100 | #38 | Exceptional 10.8% |
| Cambodians | 99.9 /100 | #39 | Exceptional 10.8% |
| Mongolians | 99.9 /100 | #40 | Exceptional 10.8% |
| Immigrants | Australia | 99.9 /100 | #41 | Exceptional 10.8% |
| Immigrants | Nepal | 99.9 /100 | #42 | Exceptional 10.8% |
| Israelis | 99.9 /100 | #43 | Exceptional 10.8% |
| Immigrants | Japan | 99.9 /100 | #44 | Exceptional 10.8% |
| Immigrants | Peru | 99.9 /100 | #45 | Exceptional 10.8% |
| Tongans | 99.9 /100 | #46 | Exceptional 10.8% |
| Taiwanese | 99.9 /100 | #47 | Exceptional 10.8% |
| Soviet Union | 99.9 /100 | #48 | Exceptional 10.9% |
| Vietnamese | 99.9 /100 | #49 | Exceptional 10.9% |
| Immigrants | Saudi Arabia | 99.9 /100 | #50 | Exceptional 10.9% |
| Peruvians | 99.8 /100 | #51 | Exceptional 10.9% |
Demographics Similar to Americans by Disability
In terms of disability, the demographic groups most similar to Americans are Paiute (13.9%, a difference of 0.42%), Apache (13.9%, a difference of 0.55%), Iroquois (13.8%, a difference of 0.84%), Menominee (13.8%, a difference of 1.1%), and Comanche (14.1%, a difference of 1.3%).
| Demographics | Rating | Rank | Disability |
| Puget Sound Salish | 0.0 /100 | #315 | Tragic 13.7% |
| Pima | 0.0 /100 | #316 | Tragic 13.7% |
| Immigrants | Cabo Verde | 0.0 /100 | #317 | Tragic 13.7% |
| Menominee | 0.0 /100 | #318 | Tragic 13.8% |
| Iroquois | 0.0 /100 | #319 | Tragic 13.8% |
| Apache | 0.0 /100 | #320 | Tragic 13.9% |
| Paiute | 0.0 /100 | #321 | Tragic 13.9% |
| Americans | 0.0 /100 | #322 | Tragic 13.9% |
| Comanche | 0.0 /100 | #323 | Tragic 14.1% |
| Chippewa | 0.0 /100 | #324 | Tragic 14.1% |
| Natives/Alaskans | 0.0 /100 | #325 | Tragic 14.2% |
| Osage | 0.0 /100 | #326 | Tragic 14.2% |
| Ottawa | 0.0 /100 | #327 | Tragic 14.2% |
| Immigrants | Azores | 0.0 /100 | #328 | Tragic 14.2% |
| Potawatomi | 0.0 /100 | #329 | Tragic 14.2% |