Immigrants from Jamaica vs Immigrants from South Africa Female Disability
COMPARE
Immigrants from Jamaica
Immigrants from South Africa
Female Disability
Female Disability Comparison
Immigrants from Jamaica
Immigrants from South Africa
12.6%
FEMALE DISABILITY
2.2/ 100
METRIC RATING
245th/ 347
METRIC RANK
11.5%
FEMALE DISABILITY
99.7/ 100
METRIC RATING
78th/ 347
METRIC RANK
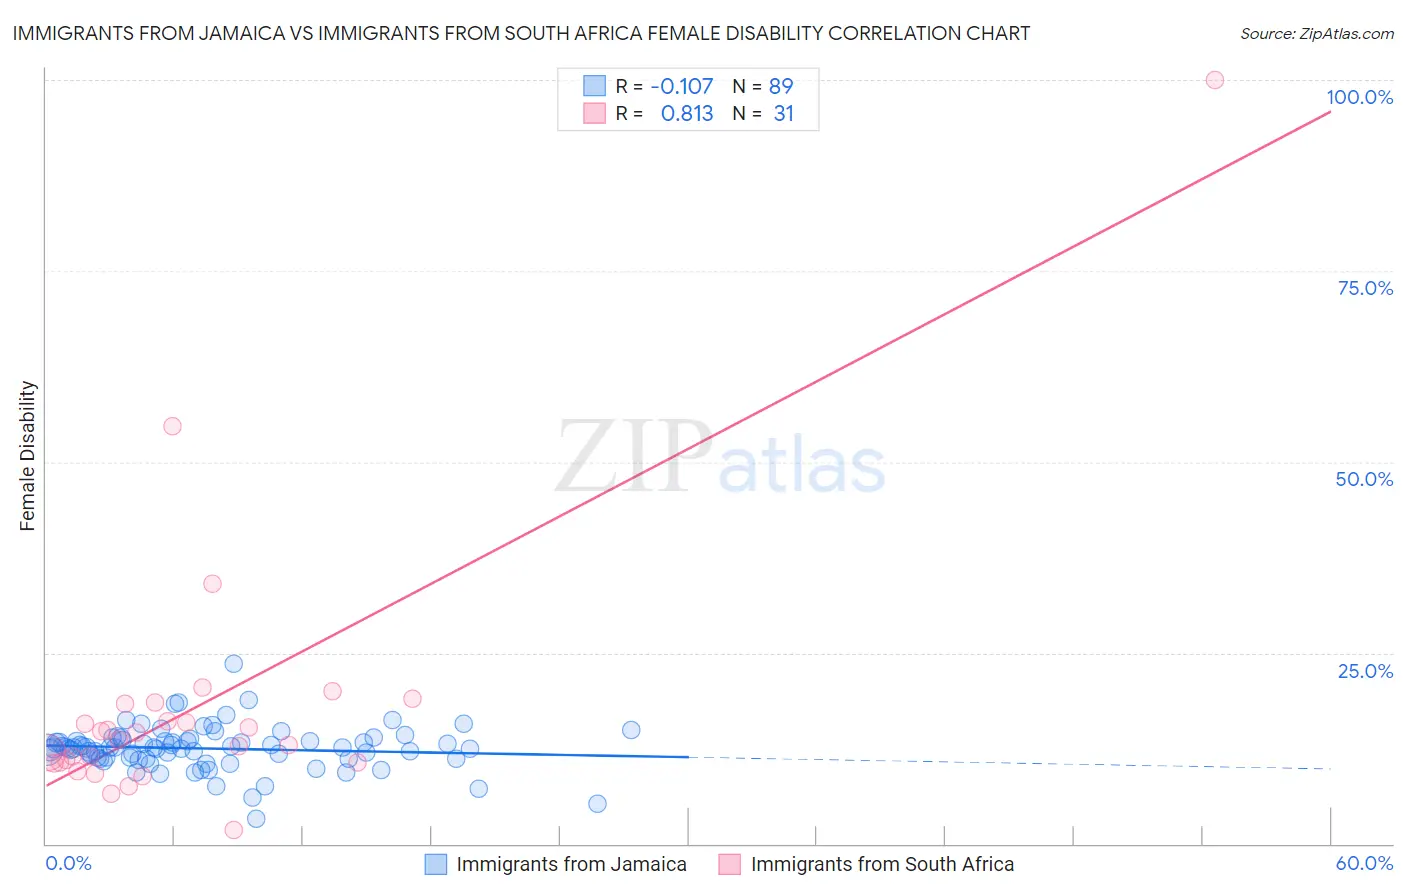
Immigrants from Jamaica vs Immigrants from South Africa Female Disability Correlation Chart
The statistical analysis conducted on geographies consisting of 301,727,948 people shows a poor negative correlation between the proportion of Immigrants from Jamaica and percentage of females with a disability in the United States with a correlation coefficient (R) of -0.107 and weighted average of 12.6%. Similarly, the statistical analysis conducted on geographies consisting of 233,307,950 people shows a very strong positive correlation between the proportion of Immigrants from South Africa and percentage of females with a disability in the United States with a correlation coefficient (R) of 0.813 and weighted average of 11.5%, a difference of 9.7%.
Female Disability Correlation Summary
| Measurement | Immigrants from Jamaica | Immigrants from South Africa |
| Minimum | 3.3% | 1.8% |
| Maximum | 23.6% | 100.0% |
| Range | 20.2% | 98.2% |
| Mean | 12.5% | 17.8% |
| Median | 12.6% | 13.6% |
| Interquartile 25% (IQ1) | 11.2% | 10.6% |
| Interquartile 75% (IQ3) | 13.5% | 18.3% |
| Interquartile Range (IQR) | 2.3% | 7.7% |
| Standard Deviation (Sample) | 2.9% | 17.8% |
| Standard Deviation (Population) | 2.8% | 17.5% |
Similar Demographics by Female Disability
Demographics Similar to Immigrants from Jamaica by Female Disability
In terms of female disability, the demographic groups most similar to Immigrants from Jamaica are Spanish American Indian (12.6%, a difference of 0.020%), Menominee (12.6%, a difference of 0.030%), Carpatho Rusyn (12.6%, a difference of 0.070%), Alsatian (12.6%, a difference of 0.14%), and Immigrants from Senegal (12.6%, a difference of 0.15%).
| Demographics | Rating | Rank | Female Disability |
| Yugoslavians | 3.7 /100 | #238 | Tragic 12.6% |
| Barbadians | 3.6 /100 | #239 | Tragic 12.6% |
| German Russians | 3.2 /100 | #240 | Tragic 12.6% |
| Japanese | 2.7 /100 | #241 | Tragic 12.6% |
| Canadians | 2.6 /100 | #242 | Tragic 12.6% |
| Immigrants | Senegal | 2.5 /100 | #243 | Tragic 12.6% |
| Alsatians | 2.5 /100 | #244 | Tragic 12.6% |
| Immigrants | Jamaica | 2.2 /100 | #245 | Tragic 12.6% |
| Spanish American Indians | 2.1 /100 | #246 | Tragic 12.6% |
| Menominee | 2.1 /100 | #247 | Tragic 12.6% |
| Carpatho Rusyns | 2.0 /100 | #248 | Tragic 12.6% |
| Immigrants | Congo | 1.8 /100 | #249 | Tragic 12.7% |
| Slovenes | 1.7 /100 | #250 | Tragic 12.7% |
| Crow | 1.6 /100 | #251 | Tragic 12.7% |
| Immigrants | Caribbean | 1.4 /100 | #252 | Tragic 12.7% |
Demographics Similar to Immigrants from South Africa by Female Disability
In terms of female disability, the demographic groups most similar to Immigrants from South Africa are Immigrants from Eritrea (11.5%, a difference of 0.010%), Immigrants from Afghanistan (11.5%, a difference of 0.010%), Sierra Leonean (11.5%, a difference of 0.020%), Immigrants from Jordan (11.5%, a difference of 0.030%), and Immigrants from Lebanon (11.5%, a difference of 0.040%).
| Demographics | Rating | Rank | Female Disability |
| Immigrants | Ireland | 99.8 /100 | #71 | Exceptional 11.5% |
| Chileans | 99.8 /100 | #72 | Exceptional 11.5% |
| Immigrants | Switzerland | 99.8 /100 | #73 | Exceptional 11.5% |
| Bhutanese | 99.8 /100 | #74 | Exceptional 11.5% |
| Immigrants | Lebanon | 99.7 /100 | #75 | Exceptional 11.5% |
| Immigrants | Eritrea | 99.7 /100 | #76 | Exceptional 11.5% |
| Immigrants | Afghanistan | 99.7 /100 | #77 | Exceptional 11.5% |
| Immigrants | South Africa | 99.7 /100 | #78 | Exceptional 11.5% |
| Sierra Leoneans | 99.7 /100 | #79 | Exceptional 11.5% |
| Immigrants | Jordan | 99.7 /100 | #80 | Exceptional 11.5% |
| Eastern Europeans | 99.7 /100 | #81 | Exceptional 11.5% |
| Luxembourgers | 99.6 /100 | #82 | Exceptional 11.6% |
| Immigrants | Serbia | 99.6 /100 | #83 | Exceptional 11.6% |
| Immigrants | Poland | 99.6 /100 | #84 | Exceptional 11.6% |
| Palestinians | 99.6 /100 | #85 | Exceptional 11.6% |