Immigrants from Italy vs Chippewa In Labor Force | Age 45-54
COMPARE
Immigrants from Italy
Chippewa
In Labor Force | Age 45-54
In Labor Force | Age 45-54 Comparison
Immigrants from Italy
Chippewa
83.2%
IN LABOR FORCE | AGE 45-54
92.5/ 100
METRIC RATING
111th/ 347
METRIC RANK
81.3%
IN LABOR FORCE | AGE 45-54
0.0/ 100
METRIC RATING
273rd/ 347
METRIC RANK
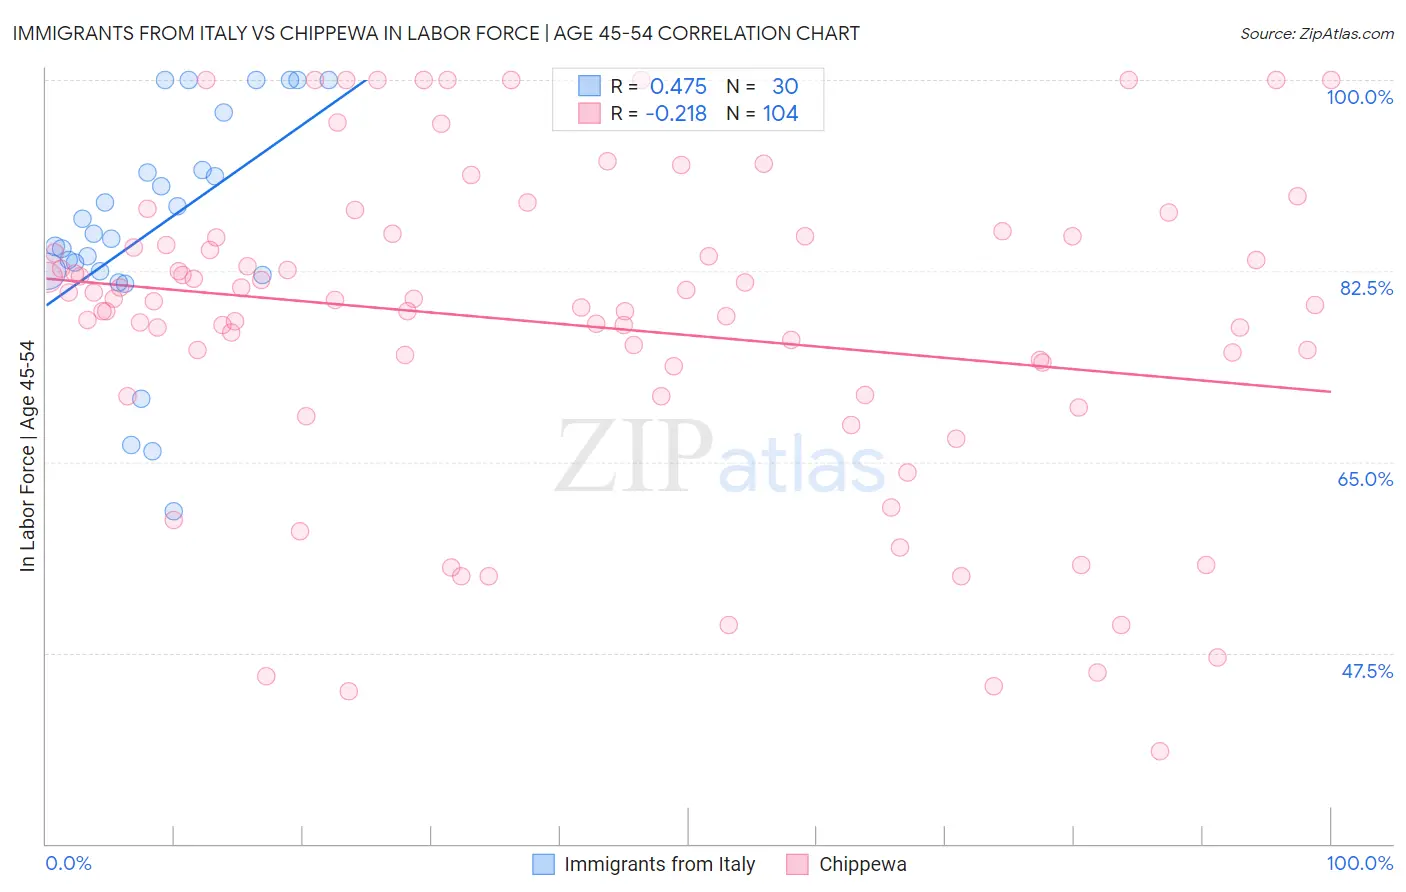
Immigrants from Italy vs Chippewa In Labor Force | Age 45-54 Correlation Chart
The statistical analysis conducted on geographies consisting of 324,135,174 people shows a moderate positive correlation between the proportion of Immigrants from Italy and labor force participation rate among population between the ages 45 and 54 in the United States with a correlation coefficient (R) of 0.475 and weighted average of 83.2%. Similarly, the statistical analysis conducted on geographies consisting of 214,988,239 people shows a weak negative correlation between the proportion of Chippewa and labor force participation rate among population between the ages 45 and 54 in the United States with a correlation coefficient (R) of -0.218 and weighted average of 81.3%, a difference of 2.4%.
In Labor Force | Age 45-54 Correlation Summary
| Measurement | Immigrants from Italy | Chippewa |
| Minimum | 60.5% | 38.5% |
| Maximum | 100.0% | 100.0% |
| Range | 39.5% | 61.5% |
| Mean | 86.4% | 77.6% |
| Median | 85.7% | 79.8% |
| Interquartile 25% (IQ1) | 82.5% | 72.5% |
| Interquartile 75% (IQ3) | 91.7% | 85.6% |
| Interquartile Range (IQR) | 9.2% | 13.2% |
| Standard Deviation (Sample) | 10.5% | 14.6% |
| Standard Deviation (Population) | 10.3% | 14.5% |
Similar Demographics by In Labor Force | Age 45-54
Demographics Similar to Immigrants from Italy by In Labor Force | Age 45-54
In terms of in labor force | age 45-54, the demographic groups most similar to Immigrants from Italy are Immigrants from Africa (83.2%, a difference of 0.0%), Immigrants from Afghanistan (83.2%, a difference of 0.0%), Iranian (83.2%, a difference of 0.010%), Slovak (83.2%, a difference of 0.010%), and Ukrainian (83.2%, a difference of 0.010%).
| Demographics | Rating | Rank | In Labor Force | Age 45-54 |
| Immigrants | Romania | 93.8 /100 | #104 | Exceptional 83.3% |
| Immigrants | South America | 93.5 /100 | #105 | Exceptional 83.2% |
| Sri Lankans | 93.2 /100 | #106 | Exceptional 83.2% |
| Iranians | 92.9 /100 | #107 | Exceptional 83.2% |
| Slovaks | 92.8 /100 | #108 | Exceptional 83.2% |
| Ukrainians | 92.7 /100 | #109 | Exceptional 83.2% |
| Immigrants | Africa | 92.6 /100 | #110 | Exceptional 83.2% |
| Immigrants | Italy | 92.5 /100 | #111 | Exceptional 83.2% |
| Immigrants | Afghanistan | 92.4 /100 | #112 | Exceptional 83.2% |
| Immigrants | Albania | 91.8 /100 | #113 | Exceptional 83.2% |
| Assyrians/Chaldeans/Syriacs | 91.7 /100 | #114 | Exceptional 83.2% |
| Immigrants | Chile | 91.6 /100 | #115 | Exceptional 83.2% |
| Immigrants | Malaysia | 91.4 /100 | #116 | Exceptional 83.2% |
| Immigrants | China | 90.9 /100 | #117 | Exceptional 83.2% |
| Immigrants | Europe | 90.7 /100 | #118 | Exceptional 83.2% |
Demographics Similar to Chippewa by In Labor Force | Age 45-54
In terms of in labor force | age 45-54, the demographic groups most similar to Chippewa are British West Indian (81.2%, a difference of 0.030%), Nonimmigrants (81.2%, a difference of 0.040%), Spanish (81.3%, a difference of 0.060%), Bangladeshi (81.3%, a difference of 0.070%), and Immigrants from Barbados (81.3%, a difference of 0.070%).
| Demographics | Rating | Rank | In Labor Force | Age 45-54 |
| Immigrants | St. Vincent and the Grenadines | 0.1 /100 | #266 | Tragic 81.4% |
| West Indians | 0.1 /100 | #267 | Tragic 81.4% |
| Immigrants | Honduras | 0.0 /100 | #268 | Tragic 81.4% |
| Alsatians | 0.0 /100 | #269 | Tragic 81.3% |
| Bangladeshis | 0.0 /100 | #270 | Tragic 81.3% |
| Immigrants | Barbados | 0.0 /100 | #271 | Tragic 81.3% |
| Spanish | 0.0 /100 | #272 | Tragic 81.3% |
| Chippewa | 0.0 /100 | #273 | Tragic 81.3% |
| British West Indians | 0.0 /100 | #274 | Tragic 81.2% |
| Immigrants | Nonimmigrants | 0.0 /100 | #275 | Tragic 81.2% |
| U.S. Virgin Islanders | 0.0 /100 | #276 | Tragic 81.2% |
| Guatemalans | 0.0 /100 | #277 | Tragic 81.2% |
| Immigrants | Guatemala | 0.0 /100 | #278 | Tragic 81.1% |
| Immigrants | Micronesia | 0.0 /100 | #279 | Tragic 81.1% |
| Immigrants | Latin America | 0.0 /100 | #280 | Tragic 81.0% |