Immigrants from Israel vs Immigrants from Ethiopia Female Disability
COMPARE
Immigrants from Israel
Immigrants from Ethiopia
Female Disability
Female Disability Comparison
Immigrants from Israel
Immigrants from Ethiopia
10.7%
FEMALE DISABILITY
100.0/ 100
METRIC RATING
12th/ 347
METRIC RANK
11.2%
FEMALE DISABILITY
100.0/ 100
METRIC RATING
38th/ 347
METRIC RANK
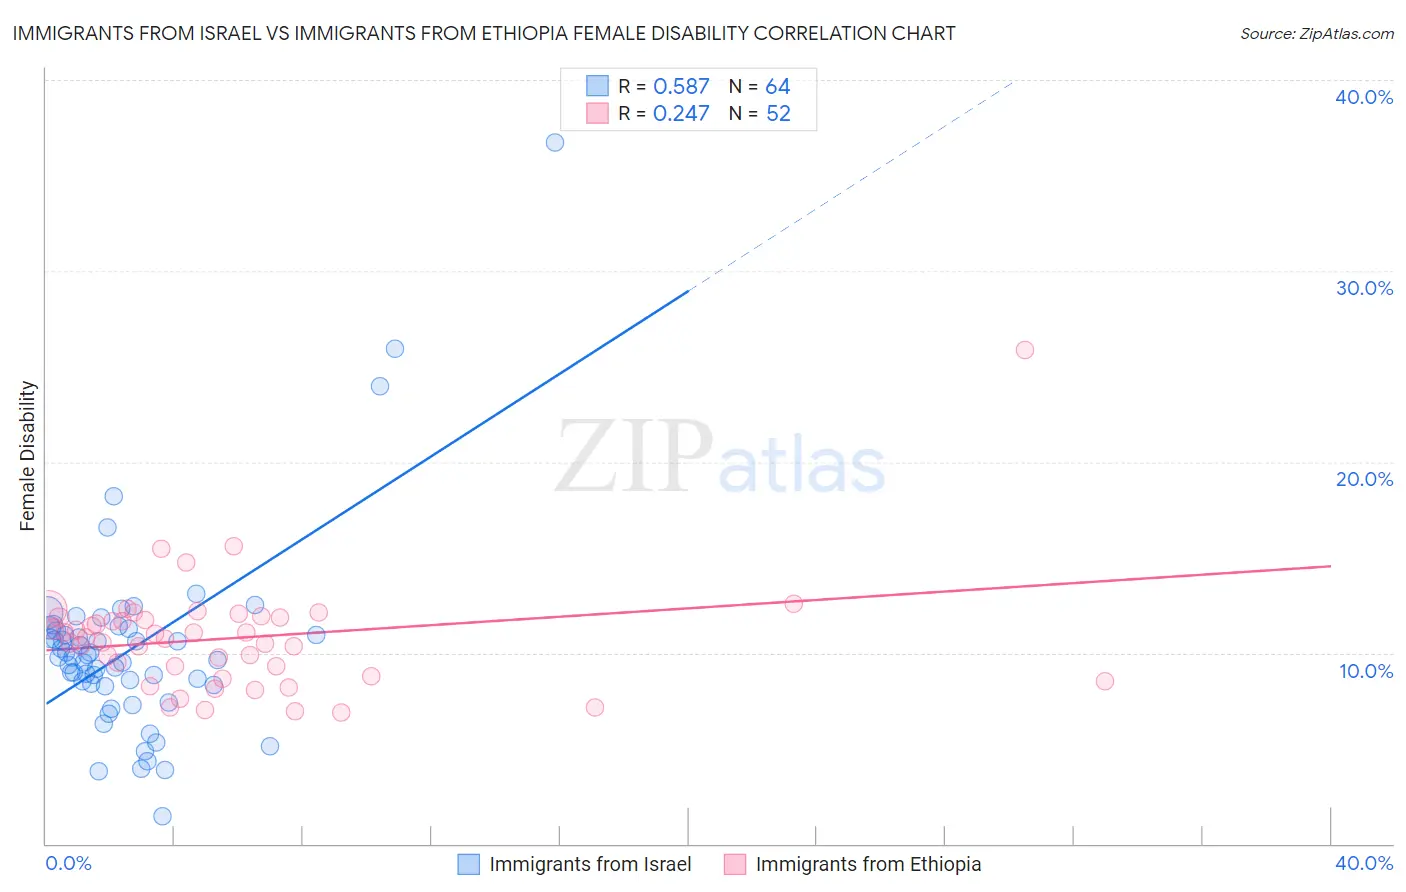
Immigrants from Israel vs Immigrants from Ethiopia Female Disability Correlation Chart
The statistical analysis conducted on geographies consisting of 210,030,994 people shows a substantial positive correlation between the proportion of Immigrants from Israel and percentage of females with a disability in the United States with a correlation coefficient (R) of 0.587 and weighted average of 10.7%. Similarly, the statistical analysis conducted on geographies consisting of 211,548,350 people shows a weak positive correlation between the proportion of Immigrants from Ethiopia and percentage of females with a disability in the United States with a correlation coefficient (R) of 0.247 and weighted average of 11.2%, a difference of 4.8%.
Female Disability Correlation Summary
| Measurement | Immigrants from Israel | Immigrants from Ethiopia |
| Minimum | 1.5% | 6.8% |
| Maximum | 36.7% | 25.9% |
| Range | 35.2% | 19.0% |
| Mean | 10.2% | 10.8% |
| Median | 9.8% | 10.8% |
| Interquartile 25% (IQ1) | 8.4% | 9.0% |
| Interquartile 75% (IQ3) | 11.2% | 11.9% |
| Interquartile Range (IQR) | 2.8% | 2.8% |
| Standard Deviation (Sample) | 5.2% | 2.9% |
| Standard Deviation (Population) | 5.2% | 2.9% |
Similar Demographics by Female Disability
Demographics Similar to Immigrants from Israel by Female Disability
In terms of female disability, the demographic groups most similar to Immigrants from Israel are Immigrants from Eastern Asia (10.7%, a difference of 0.070%), Immigrants from China (10.7%, a difference of 0.11%), Immigrants from Korea (10.6%, a difference of 0.42%), Immigrants from Hong Kong (10.6%, a difference of 0.59%), and Burmese (10.7%, a difference of 0.62%).
| Demographics | Rating | Rank | Female Disability |
| Immigrants | Bolivia | 100.0 /100 | #5 | Exceptional 10.3% |
| Bolivians | 100.0 /100 | #6 | Exceptional 10.4% |
| Immigrants | Singapore | 100.0 /100 | #7 | Exceptional 10.4% |
| Immigrants | South Central Asia | 100.0 /100 | #8 | Exceptional 10.5% |
| Iranians | 100.0 /100 | #9 | Exceptional 10.6% |
| Immigrants | Hong Kong | 100.0 /100 | #10 | Exceptional 10.6% |
| Immigrants | Korea | 100.0 /100 | #11 | Exceptional 10.6% |
| Immigrants | Israel | 100.0 /100 | #12 | Exceptional 10.7% |
| Immigrants | Eastern Asia | 100.0 /100 | #13 | Exceptional 10.7% |
| Immigrants | China | 100.0 /100 | #14 | Exceptional 10.7% |
| Burmese | 100.0 /100 | #15 | Exceptional 10.7% |
| Okinawans | 100.0 /100 | #16 | Exceptional 10.8% |
| Indians (Asian) | 100.0 /100 | #17 | Exceptional 10.8% |
| Immigrants | Iran | 100.0 /100 | #18 | Exceptional 10.8% |
| Immigrants | Venezuela | 100.0 /100 | #19 | Exceptional 10.9% |
Demographics Similar to Immigrants from Ethiopia by Female Disability
In terms of female disability, the demographic groups most similar to Immigrants from Ethiopia are Ethiopian (11.2%, a difference of 0.030%), Cypriot (11.2%, a difference of 0.040%), Immigrants from Japan (11.2%, a difference of 0.11%), Immigrants from Lithuania (11.2%, a difference of 0.21%), and Mongolian (11.2%, a difference of 0.24%).
| Demographics | Rating | Rank | Female Disability |
| Immigrants | Kuwait | 100.0 /100 | #31 | Exceptional 11.1% |
| Immigrants | Australia | 100.0 /100 | #32 | Exceptional 11.1% |
| Immigrants | Egypt | 100.0 /100 | #33 | Exceptional 11.1% |
| Immigrants | Indonesia | 100.0 /100 | #34 | Exceptional 11.2% |
| Immigrants | Japan | 100.0 /100 | #35 | Exceptional 11.2% |
| Cypriots | 100.0 /100 | #36 | Exceptional 11.2% |
| Ethiopians | 100.0 /100 | #37 | Exceptional 11.2% |
| Immigrants | Ethiopia | 100.0 /100 | #38 | Exceptional 11.2% |
| Immigrants | Lithuania | 100.0 /100 | #39 | Exceptional 11.2% |
| Mongolians | 100.0 /100 | #40 | Exceptional 11.2% |
| Paraguayans | 100.0 /100 | #41 | Exceptional 11.2% |
| Israelis | 100.0 /100 | #42 | Exceptional 11.2% |
| Afghans | 100.0 /100 | #43 | Exceptional 11.2% |
| Cambodians | 100.0 /100 | #44 | Exceptional 11.3% |
| Immigrants | Sweden | 100.0 /100 | #45 | Exceptional 11.3% |