Immigrants from Israel vs Hungarian Unemployment Among Seniors over 65 years
COMPARE
Immigrants from Israel
Hungarian
Unemployment Among Seniors over 65 years
Unemployment Among Seniors over 65 years Comparison
Immigrants from Israel
Hungarians
5.3%
UNEMPLOYMENT AMONG SENIORS OVER 65 YEARS
2.0/ 100
METRIC RATING
238th/ 347
METRIC RANK
5.3%
UNEMPLOYMENT AMONG SENIORS OVER 65 YEARS
3.9/ 100
METRIC RATING
231st/ 347
METRIC RANK
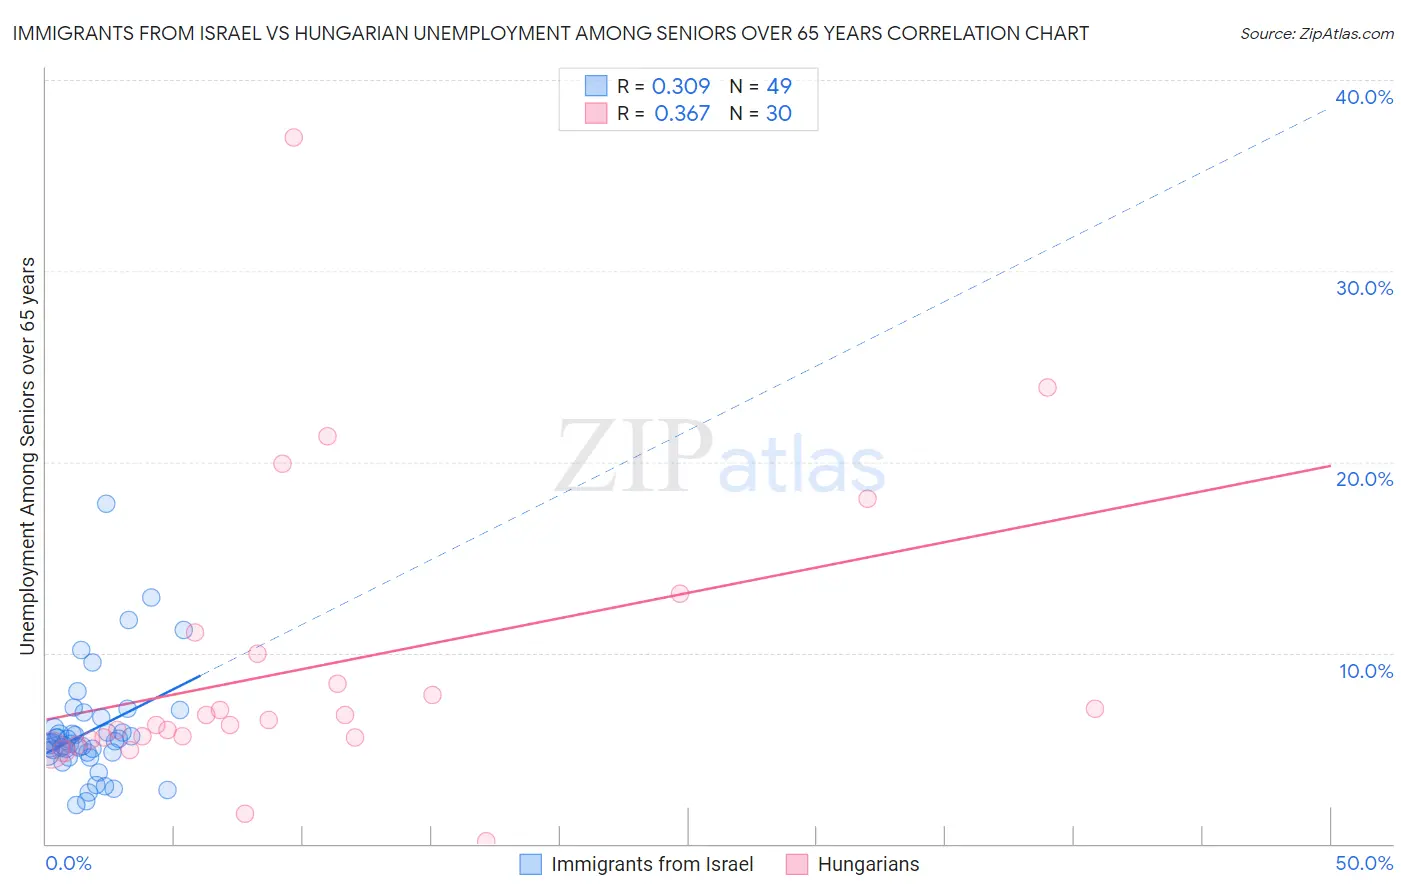
Immigrants from Israel vs Hungarian Unemployment Among Seniors over 65 years Correlation Chart
The statistical analysis conducted on geographies consisting of 201,020,149 people shows a mild positive correlation between the proportion of Immigrants from Israel and unemployment rate amomg seniors over the age of 65 in the United States with a correlation coefficient (R) of 0.309 and weighted average of 5.3%. Similarly, the statistical analysis conducted on geographies consisting of 418,050,332 people shows a mild positive correlation between the proportion of Hungarians and unemployment rate amomg seniors over the age of 65 in the United States with a correlation coefficient (R) of 0.367 and weighted average of 5.3%, a difference of 0.54%.
Unemployment Among Seniors over 65 years Correlation Summary
| Measurement | Immigrants from Israel | Hungarian |
| Minimum | 2.0% | 0.10% |
| Maximum | 17.8% | 37.0% |
| Range | 15.8% | 36.9% |
| Mean | 5.9% | 9.3% |
| Median | 5.3% | 6.4% |
| Interquartile 25% (IQ1) | 4.8% | 5.6% |
| Interquartile 75% (IQ3) | 6.3% | 9.9% |
| Interquartile Range (IQR) | 1.6% | 4.4% |
| Standard Deviation (Sample) | 2.9% | 7.6% |
| Standard Deviation (Population) | 2.8% | 7.5% |
Demographics Similar to Immigrants from Israel and Hungarians by Unemployment Among Seniors over 65 years
In terms of unemployment among seniors over 65 years, the demographic groups most similar to Immigrants from Israel are Immigrants from Greece (5.3%, a difference of 0.010%), Immigrants from Senegal (5.3%, a difference of 0.060%), Immigrants from Costa Rica (5.3%, a difference of 0.070%), Immigrants from Trinidad and Tobago (5.3%, a difference of 0.17%), and Immigrants from Albania (5.3%, a difference of 0.26%). Similarly, the demographic groups most similar to Hungarians are Immigrants from Argentina (5.3%, a difference of 0.030%), Samoan (5.3%, a difference of 0.070%), Hopi (5.3%, a difference of 0.080%), Haitian (5.3%, a difference of 0.10%), and Marshallese (5.3%, a difference of 0.17%).
| Demographics | Rating | Rank | Unemployment Among Seniors over 65 years |
| Immigrants | Syria | 5.6 /100 | #224 | Tragic 5.3% |
| Hondurans | 5.6 /100 | #225 | Tragic 5.3% |
| Immigrants | Croatia | 5.3 /100 | #226 | Tragic 5.3% |
| French American Indians | 5.2 /100 | #227 | Tragic 5.3% |
| Haitians | 4.4 /100 | #228 | Tragic 5.3% |
| Samoans | 4.2 /100 | #229 | Tragic 5.3% |
| Immigrants | Argentina | 4.0 /100 | #230 | Tragic 5.3% |
| Hungarians | 3.9 /100 | #231 | Tragic 5.3% |
| Hopi | 3.5 /100 | #232 | Tragic 5.3% |
| Marshallese | 3.1 /100 | #233 | Tragic 5.3% |
| Blackfeet | 3.1 /100 | #234 | Tragic 5.3% |
| Immigrants | Albania | 2.7 /100 | #235 | Tragic 5.3% |
| Immigrants | Costa Rica | 2.1 /100 | #236 | Tragic 5.3% |
| Immigrants | Greece | 2.0 /100 | #237 | Tragic 5.3% |
| Immigrants | Israel | 2.0 /100 | #238 | Tragic 5.3% |
| Immigrants | Senegal | 1.8 /100 | #239 | Tragic 5.3% |
| Immigrants | Trinidad and Tobago | 1.6 /100 | #240 | Tragic 5.3% |
| Apache | 1.3 /100 | #241 | Tragic 5.3% |
| Bahamians | 0.9 /100 | #242 | Tragic 5.3% |
| Nigerians | 0.9 /100 | #243 | Tragic 5.3% |
| Peruvians | 0.8 /100 | #244 | Tragic 5.3% |