Immigrants from Israel vs Immigrants from India Ambulatory Disability
COMPARE
Immigrants from Israel
Immigrants from India
Ambulatory Disability
Ambulatory Disability Comparison
Immigrants from Israel
Immigrants from India
5.4%
AMBULATORY DISABILITY
100.0/ 100
METRIC RATING
22nd/ 347
METRIC RANK
4.8%
AMBULATORY DISABILITY
100.0/ 100
METRIC RATING
1st/ 347
METRIC RANK
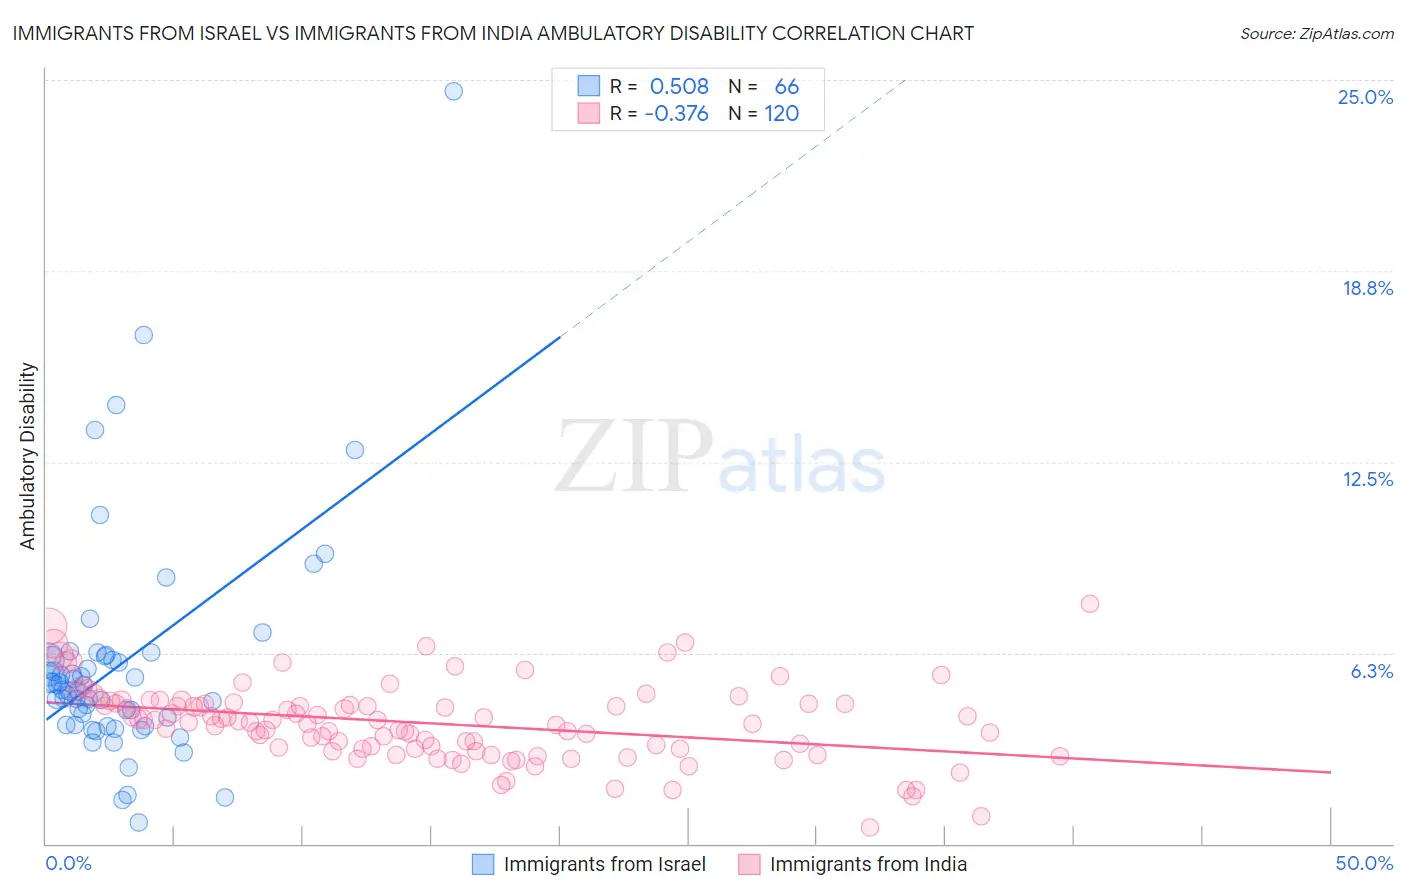
Immigrants from Israel vs Immigrants from India Ambulatory Disability Correlation Chart
The statistical analysis conducted on geographies consisting of 210,002,102 people shows a substantial positive correlation between the proportion of Immigrants from Israel and percentage of population with ambulatory disability in the United States with a correlation coefficient (R) of 0.508 and weighted average of 5.4%. Similarly, the statistical analysis conducted on geographies consisting of 433,949,483 people shows a mild negative correlation between the proportion of Immigrants from India and percentage of population with ambulatory disability in the United States with a correlation coefficient (R) of -0.376 and weighted average of 4.8%, a difference of 12.9%.
Ambulatory Disability Correlation Summary
| Measurement | Immigrants from Israel | Immigrants from India |
| Minimum | 0.69% | 0.54% |
| Maximum | 24.6% | 7.8% |
| Range | 24.0% | 7.3% |
| Mean | 5.8% | 4.0% |
| Median | 5.1% | 4.0% |
| Interquartile 25% (IQ1) | 3.9% | 3.1% |
| Interquartile 75% (IQ3) | 6.1% | 4.6% |
| Interquartile Range (IQR) | 2.2% | 1.5% |
| Standard Deviation (Sample) | 3.7% | 1.3% |
| Standard Deviation (Population) | 3.7% | 1.2% |
Similar Demographics by Ambulatory Disability
Demographics Similar to Immigrants from Israel by Ambulatory Disability
In terms of ambulatory disability, the demographic groups most similar to Immigrants from Israel are Tongan (5.4%, a difference of 0.040%), Immigrants from Saudi Arabia (5.4%, a difference of 0.13%), Zimbabwean (5.4%, a difference of 0.21%), Immigrants from Nepal (5.4%, a difference of 0.25%), and Ethiopian (5.4%, a difference of 0.37%).
| Demographics | Rating | Rank | Ambulatory Disability |
| Immigrants | China | 100.0 /100 | #15 | Exceptional 5.3% |
| Immigrants | Hong Kong | 100.0 /100 | #16 | Exceptional 5.3% |
| Immigrants | Ethiopia | 100.0 /100 | #17 | Exceptional 5.4% |
| Immigrants | Sri Lanka | 100.0 /100 | #18 | Exceptional 5.4% |
| Indians (Asian) | 100.0 /100 | #19 | Exceptional 5.4% |
| Ethiopians | 100.0 /100 | #20 | Exceptional 5.4% |
| Immigrants | Kuwait | 100.0 /100 | #21 | Exceptional 5.4% |
| Immigrants | Israel | 100.0 /100 | #22 | Exceptional 5.4% |
| Tongans | 100.0 /100 | #23 | Exceptional 5.4% |
| Immigrants | Saudi Arabia | 100.0 /100 | #24 | Exceptional 5.4% |
| Zimbabweans | 100.0 /100 | #25 | Exceptional 5.4% |
| Immigrants | Nepal | 100.0 /100 | #26 | Exceptional 5.4% |
| Asians | 100.0 /100 | #27 | Exceptional 5.4% |
| Cambodians | 100.0 /100 | #28 | Exceptional 5.4% |
| Immigrants | Iran | 100.0 /100 | #29 | Exceptional 5.4% |
Demographics Similar to Immigrants from India by Ambulatory Disability
In terms of ambulatory disability, the demographic groups most similar to Immigrants from India are Filipino (4.9%, a difference of 2.0%), Thai (4.9%, a difference of 3.2%), Immigrants from Taiwan (4.9%, a difference of 3.5%), Immigrants from Singapore (5.0%, a difference of 4.9%), and Immigrants from Bolivia (5.0%, a difference of 5.7%).
| Demographics | Rating | Rank | Ambulatory Disability |
| Immigrants | India | 100.0 /100 | #1 | Exceptional 4.8% |
| Filipinos | 100.0 /100 | #2 | Exceptional 4.9% |
| Thais | 100.0 /100 | #3 | Exceptional 4.9% |
| Immigrants | Taiwan | 100.0 /100 | #4 | Exceptional 4.9% |
| Immigrants | Singapore | 100.0 /100 | #5 | Exceptional 5.0% |
| Immigrants | Bolivia | 100.0 /100 | #6 | Exceptional 5.0% |
| Bolivians | 100.0 /100 | #7 | Exceptional 5.1% |
| Immigrants | South Central Asia | 100.0 /100 | #8 | Exceptional 5.1% |
| Iranians | 100.0 /100 | #9 | Exceptional 5.1% |
| Yup'ik | 100.0 /100 | #10 | Exceptional 5.2% |
| Immigrants | Korea | 100.0 /100 | #11 | Exceptional 5.2% |
| Okinawans | 100.0 /100 | #12 | Exceptional 5.3% |
| Burmese | 100.0 /100 | #13 | Exceptional 5.3% |
| Immigrants | Eastern Asia | 100.0 /100 | #14 | Exceptional 5.3% |
| Immigrants | China | 100.0 /100 | #15 | Exceptional 5.3% |