Immigrants from Ireland vs Lebanese 5th Grade
COMPARE
Immigrants from Ireland
Lebanese
5th Grade
5th Grade Comparison
Immigrants from Ireland
Lebanese
97.8%
5TH GRADE
98.8/ 100
METRIC RATING
90th/ 347
METRIC RANK
97.6%
5TH GRADE
95.7/ 100
METRIC RATING
114th/ 347
METRIC RANK
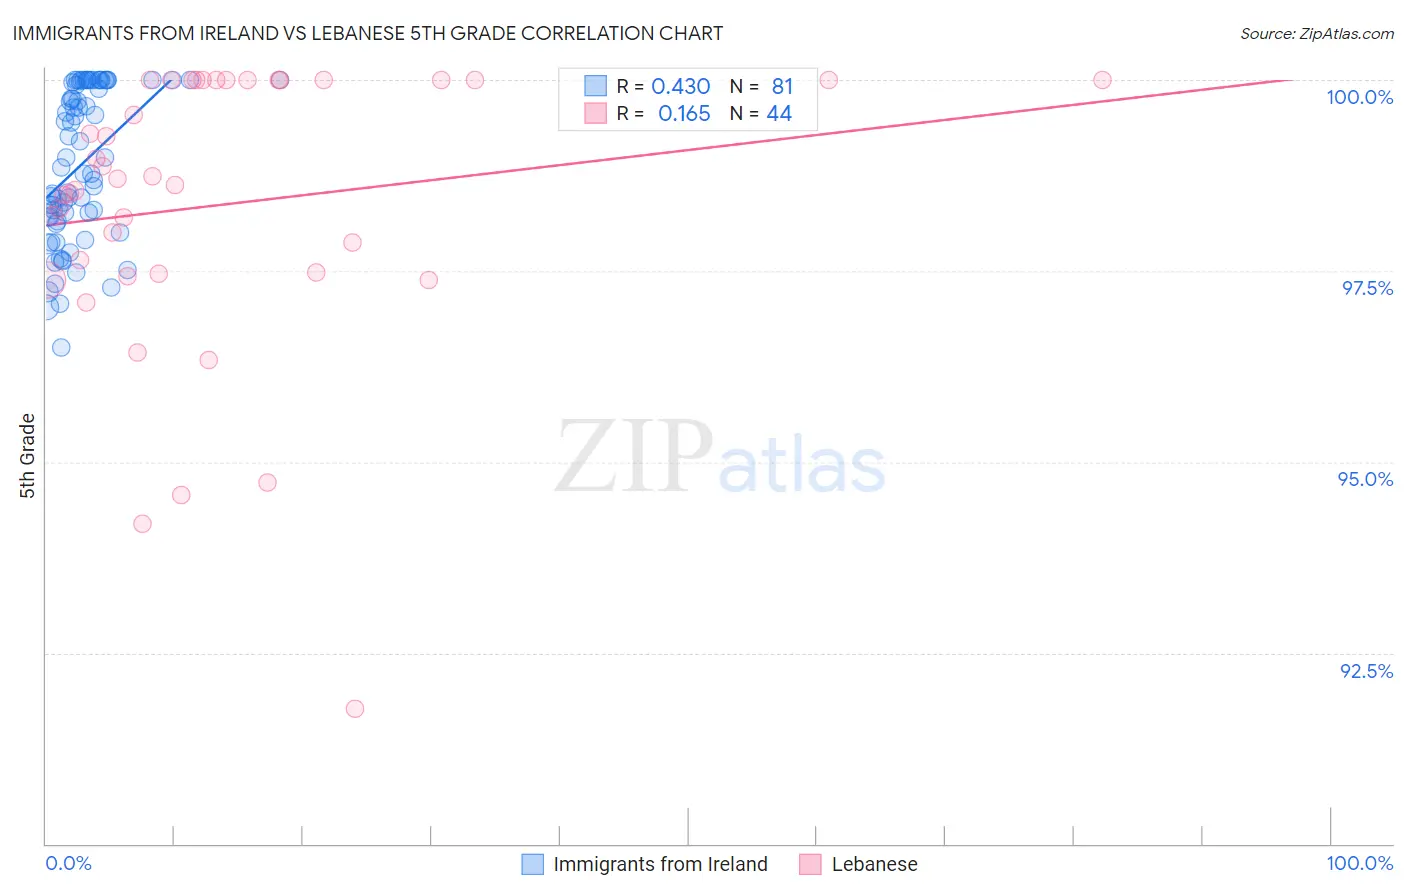
Immigrants from Ireland vs Lebanese 5th Grade Correlation Chart
The statistical analysis conducted on geographies consisting of 240,784,498 people shows a moderate positive correlation between the proportion of Immigrants from Ireland and percentage of population with at least 5th grade education in the United States with a correlation coefficient (R) of 0.430 and weighted average of 97.8%. Similarly, the statistical analysis conducted on geographies consisting of 401,624,157 people shows a poor positive correlation between the proportion of Lebanese and percentage of population with at least 5th grade education in the United States with a correlation coefficient (R) of 0.165 and weighted average of 97.6%, a difference of 0.13%.
5th Grade Correlation Summary
| Measurement | Immigrants from Ireland | Lebanese |
| Minimum | 96.5% | 91.8% |
| Maximum | 100.0% | 100.0% |
| Range | 3.5% | 8.2% |
| Mean | 98.9% | 98.4% |
| Median | 98.8% | 98.7% |
| Interquartile 25% (IQ1) | 98.2% | 97.5% |
| Interquartile 75% (IQ3) | 100.0% | 100.0% |
| Interquartile Range (IQR) | 1.8% | 2.5% |
| Standard Deviation (Sample) | 0.99% | 1.9% |
| Standard Deviation (Population) | 0.98% | 1.8% |
Similar Demographics by 5th Grade
Demographics Similar to Immigrants from Ireland by 5th Grade
In terms of 5th grade, the demographic groups most similar to Immigrants from Ireland are Immigrants from Australia (97.8%, a difference of 0.0%), Shoshone (97.8%, a difference of 0.0%), Immigrants from South Africa (97.8%, a difference of 0.0%), Immigrants from Western Europe (97.8%, a difference of 0.0%), and Cypriot (97.8%, a difference of 0.010%).
| Demographics | Rating | Rank | 5th Grade |
| Zimbabweans | 99.0 /100 | #83 | Exceptional 97.8% |
| Potawatomi | 99.0 /100 | #84 | Exceptional 97.8% |
| Immigrants | Belgium | 99.0 /100 | #85 | Exceptional 97.8% |
| Cypriots | 98.9 /100 | #86 | Exceptional 97.8% |
| Immigrants | Australia | 98.8 /100 | #87 | Exceptional 97.8% |
| Shoshone | 98.8 /100 | #88 | Exceptional 97.8% |
| Immigrants | South Africa | 98.8 /100 | #89 | Exceptional 97.8% |
| Immigrants | Ireland | 98.8 /100 | #90 | Exceptional 97.8% |
| Immigrants | Western Europe | 98.8 /100 | #91 | Exceptional 97.8% |
| Immigrants | Sweden | 98.7 /100 | #92 | Exceptional 97.8% |
| Delaware | 98.6 /100 | #93 | Exceptional 97.8% |
| Immigrants | Denmark | 98.6 /100 | #94 | Exceptional 97.8% |
| Romanians | 98.6 /100 | #95 | Exceptional 97.8% |
| Immigrants | Germany | 98.5 /100 | #96 | Exceptional 97.8% |
| Cree | 98.4 /100 | #97 | Exceptional 97.7% |
Demographics Similar to Lebanese by 5th Grade
In terms of 5th grade, the demographic groups most similar to Lebanese are Okinawan (97.6%, a difference of 0.0%), Immigrants from Croatia (97.6%, a difference of 0.0%), Immigrants from Switzerland (97.7%, a difference of 0.010%), Iroquois (97.7%, a difference of 0.010%), and Immigrants from Saudi Arabia (97.6%, a difference of 0.010%).
| Demographics | Rating | Rank | 5th Grade |
| Immigrants | Singapore | 97.5 /100 | #107 | Exceptional 97.7% |
| Immigrants | Nonimmigrants | 97.3 /100 | #108 | Exceptional 97.7% |
| Immigrants | Latvia | 97.1 /100 | #109 | Exceptional 97.7% |
| Thais | 96.9 /100 | #110 | Exceptional 97.7% |
| Menominee | 96.3 /100 | #111 | Exceptional 97.7% |
| Immigrants | Switzerland | 96.0 /100 | #112 | Exceptional 97.7% |
| Iroquois | 95.9 /100 | #113 | Exceptional 97.7% |
| Lebanese | 95.7 /100 | #114 | Exceptional 97.6% |
| Okinawans | 95.7 /100 | #115 | Exceptional 97.6% |
| Immigrants | Croatia | 95.5 /100 | #116 | Exceptional 97.6% |
| Immigrants | Saudi Arabia | 95.4 /100 | #117 | Exceptional 97.6% |
| Basques | 95.2 /100 | #118 | Exceptional 97.6% |
| Syrians | 95.1 /100 | #119 | Exceptional 97.6% |
| Immigrants | Zimbabwe | 94.9 /100 | #120 | Exceptional 97.6% |
| Immigrants | France | 94.8 /100 | #121 | Exceptional 97.6% |