Immigrants from Ireland vs Chinese Disability Age Under 5
COMPARE
Immigrants from Ireland
Chinese
Disability Age Under 5
Disability Age Under 5 Comparison
Immigrants from Ireland
Chinese
1.2%
DISABILITY AGE UNDER 5
50.3/ 100
METRIC RATING
173rd/ 347
METRIC RANK
1.1%
DISABILITY AGE UNDER 5
97.2/ 100
METRIC RATING
90th/ 347
METRIC RANK
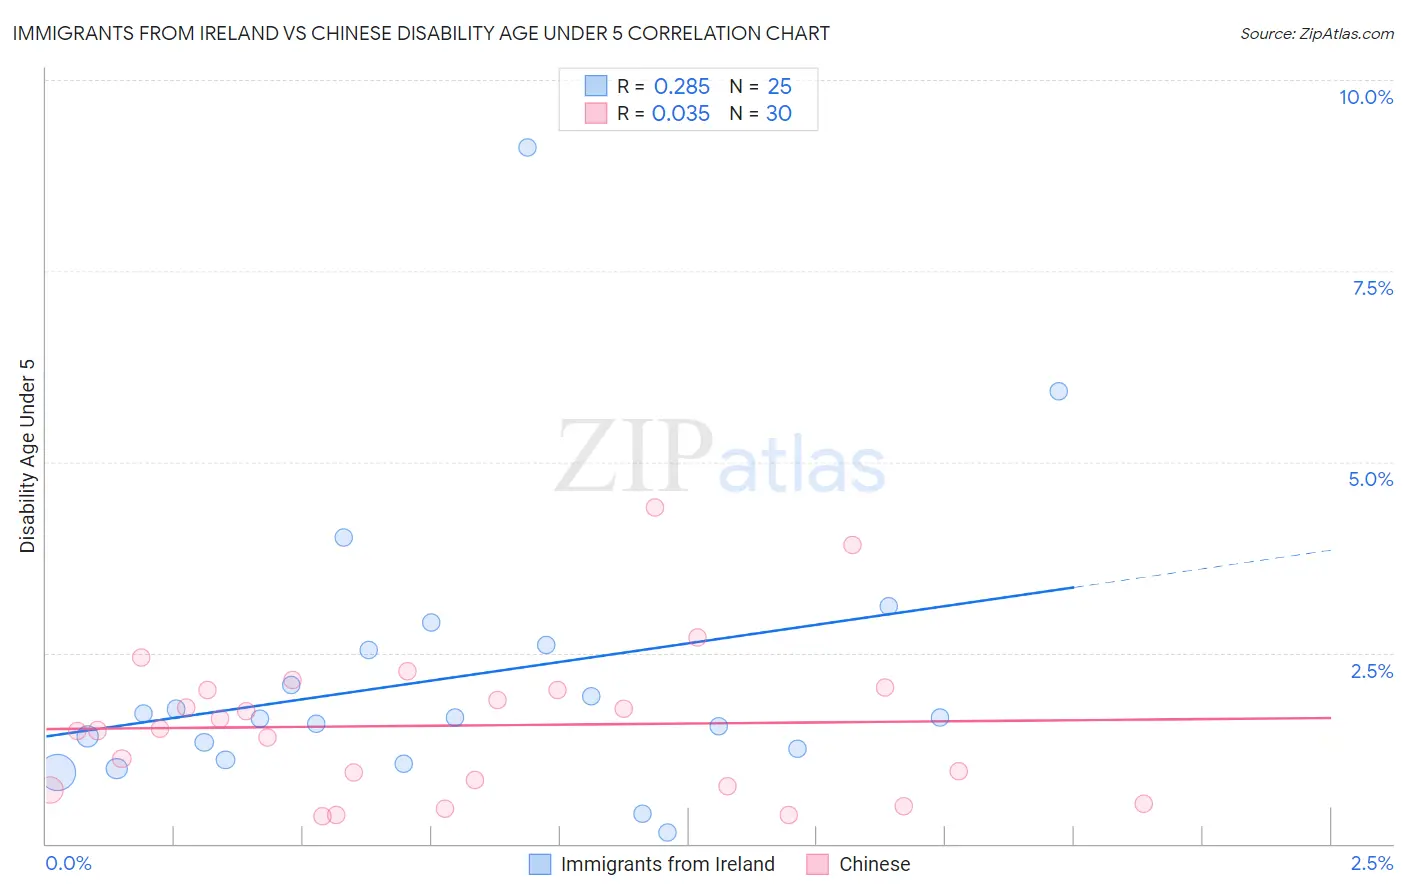
Immigrants from Ireland vs Chinese Disability Age Under 5 Correlation Chart
The statistical analysis conducted on geographies consisting of 143,988,066 people shows a weak positive correlation between the proportion of Immigrants from Ireland and percentage of population with a disability under the age of 5 in the United States with a correlation coefficient (R) of 0.285 and weighted average of 1.2%. Similarly, the statistical analysis conducted on geographies consisting of 53,046,332 people shows no correlation between the proportion of Chinese and percentage of population with a disability under the age of 5 in the United States with a correlation coefficient (R) of 0.035 and weighted average of 1.1%, a difference of 8.7%.
Disability Age Under 5 Correlation Summary
| Measurement | Immigrants from Ireland | Chinese |
| Minimum | 0.14% | 0.35% |
| Maximum | 9.1% | 4.4% |
| Range | 9.0% | 4.0% |
| Mean | 2.2% | 1.5% |
| Median | 1.7% | 1.5% |
| Interquartile 25% (IQ1) | 1.2% | 0.75% |
| Interquartile 75% (IQ3) | 2.6% | 2.0% |
| Interquartile Range (IQR) | 1.4% | 1.3% |
| Standard Deviation (Sample) | 1.9% | 0.98% |
| Standard Deviation (Population) | 1.8% | 0.97% |
Similar Demographics by Disability Age Under 5
Demographics Similar to Immigrants from Ireland by Disability Age Under 5
In terms of disability age under 5, the demographic groups most similar to Immigrants from Ireland are Immigrants from Latvia (1.2%, a difference of 0.020%), Immigrants from Nigeria (1.2%, a difference of 0.030%), Crow (1.2%, a difference of 0.070%), Immigrants from Kenya (1.2%, a difference of 0.15%), and Comanche (1.2%, a difference of 0.25%).
| Demographics | Rating | Rank | Disability Age Under 5 |
| Immigrants | Central America | 61.4 /100 | #166 | Good 1.2% |
| Immigrants | Argentina | 60.2 /100 | #167 | Good 1.2% |
| Sierra Leoneans | 59.1 /100 | #168 | Average 1.2% |
| Immigrants | Uruguay | 59.0 /100 | #169 | Average 1.2% |
| Immigrants | Jamaica | 58.8 /100 | #170 | Average 1.2% |
| Guamanians/Chamorros | 57.8 /100 | #171 | Average 1.2% |
| Crow | 51.0 /100 | #172 | Average 1.2% |
| Immigrants | Ireland | 50.3 /100 | #173 | Average 1.2% |
| Immigrants | Latvia | 50.0 /100 | #174 | Average 1.2% |
| Immigrants | Nigeria | 50.0 /100 | #175 | Average 1.2% |
| Immigrants | Kenya | 48.6 /100 | #176 | Average 1.2% |
| Comanche | 47.5 /100 | #177 | Average 1.2% |
| Venezuelans | 47.1 /100 | #178 | Average 1.2% |
| Immigrants | Bahamas | 45.2 /100 | #179 | Average 1.2% |
| Immigrants | Mexico | 44.4 /100 | #180 | Average 1.2% |
Demographics Similar to Chinese by Disability Age Under 5
In terms of disability age under 5, the demographic groups most similar to Chinese are Ethiopian (1.1%, a difference of 0.030%), Albanian (1.1%, a difference of 0.040%), Immigrants from Cuba (1.1%, a difference of 0.21%), Spanish American (1.1%, a difference of 0.24%), and Sri Lankan (1.1%, a difference of 0.30%).
| Demographics | Rating | Rank | Disability Age Under 5 |
| Immigrants | Syria | 97.9 /100 | #83 | Exceptional 1.1% |
| Immigrants | Zaire | 97.8 /100 | #84 | Exceptional 1.1% |
| Sudanese | 97.7 /100 | #85 | Exceptional 1.1% |
| Okinawans | 97.6 /100 | #86 | Exceptional 1.1% |
| Ugandans | 97.5 /100 | #87 | Exceptional 1.1% |
| Immigrants | Dominican Republic | 97.5 /100 | #88 | Exceptional 1.1% |
| Ethiopians | 97.2 /100 | #89 | Exceptional 1.1% |
| Chinese | 97.2 /100 | #90 | Exceptional 1.1% |
| Albanians | 97.2 /100 | #91 | Exceptional 1.1% |
| Immigrants | Cuba | 97.0 /100 | #92 | Exceptional 1.1% |
| Spanish Americans | 96.9 /100 | #93 | Exceptional 1.1% |
| Sri Lankans | 96.8 /100 | #94 | Exceptional 1.1% |
| Immigrants | Moldova | 96.8 /100 | #95 | Exceptional 1.1% |
| Mongolians | 96.6 /100 | #96 | Exceptional 1.1% |
| Immigrants | Iraq | 96.5 /100 | #97 | Exceptional 1.1% |