Immigrants from Romania vs Immigrants from Ethiopia Vision Disability
COMPARE
Immigrants from Romania
Immigrants from Ethiopia
Vision Disability
Vision Disability Comparison
Immigrants from Romania
Immigrants from Ethiopia
2.0%
VISION DISABILITY
99.1/ 100
METRIC RATING
60th/ 347
METRIC RANK
2.0%
VISION DISABILITY
99.7/ 100
METRIC RATING
42nd/ 347
METRIC RANK
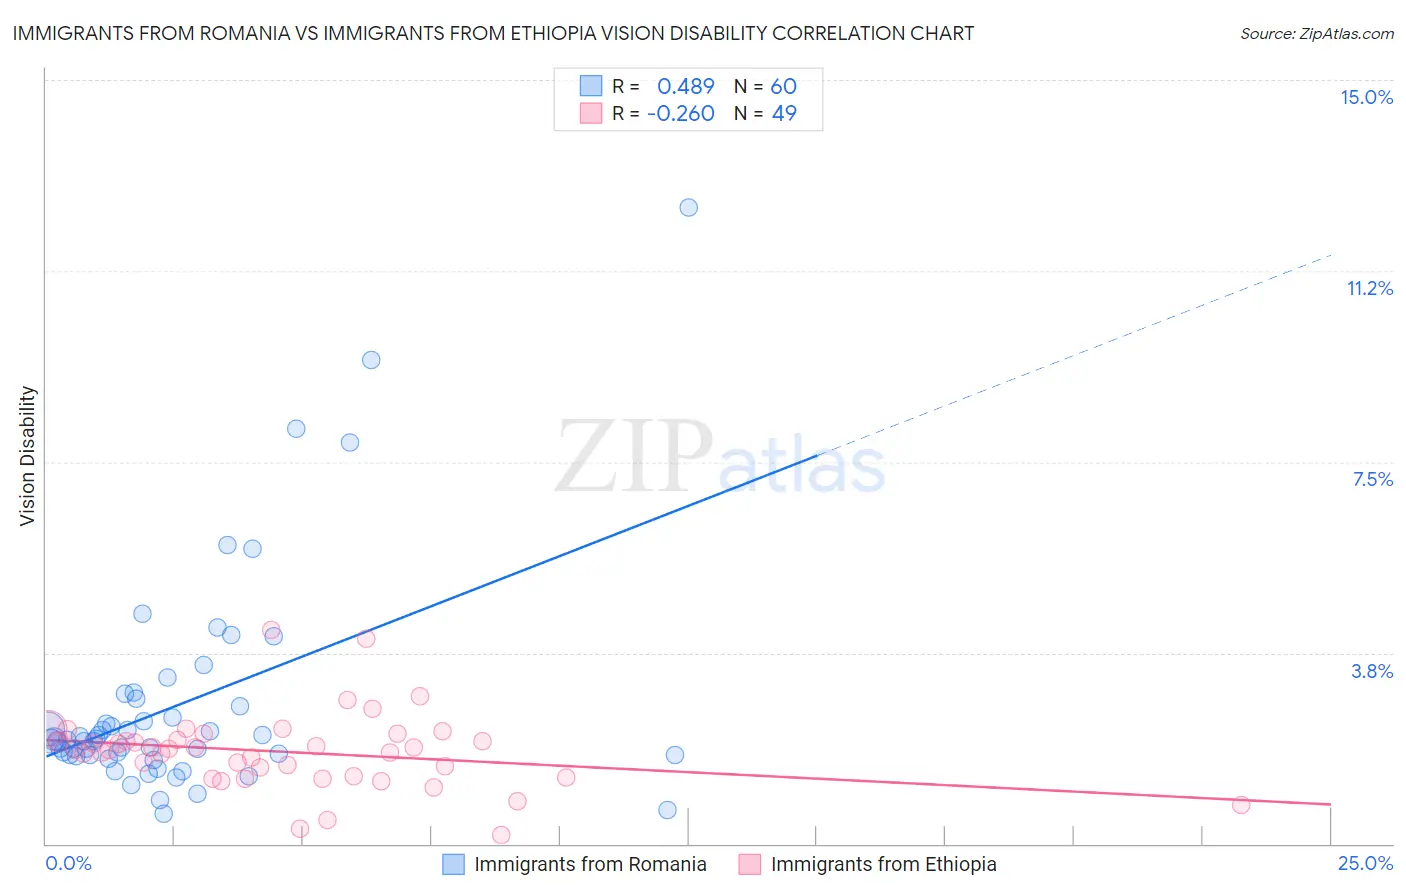
Immigrants from Romania vs Immigrants from Ethiopia Vision Disability Correlation Chart
The statistical analysis conducted on geographies consisting of 256,950,873 people shows a moderate positive correlation between the proportion of Immigrants from Romania and percentage of population with vision disability in the United States with a correlation coefficient (R) of 0.489 and weighted average of 2.0%. Similarly, the statistical analysis conducted on geographies consisting of 211,444,224 people shows a weak negative correlation between the proportion of Immigrants from Ethiopia and percentage of population with vision disability in the United States with a correlation coefficient (R) of -0.260 and weighted average of 2.0%, a difference of 1.8%.
Vision Disability Correlation Summary
| Measurement | Immigrants from Romania | Immigrants from Ethiopia |
| Minimum | 0.58% | 0.17% |
| Maximum | 12.5% | 4.2% |
| Range | 11.9% | 4.0% |
| Mean | 2.7% | 1.8% |
| Median | 2.0% | 1.9% |
| Interquartile 25% (IQ1) | 1.7% | 1.3% |
| Interquartile 75% (IQ3) | 2.8% | 2.1% |
| Interquartile Range (IQR) | 1.0% | 0.79% |
| Standard Deviation (Sample) | 2.2% | 0.74% |
| Standard Deviation (Population) | 2.1% | 0.74% |
Demographics Similar to Immigrants from Romania and Immigrants from Ethiopia by Vision Disability
In terms of vision disability, the demographic groups most similar to Immigrants from Romania are Immigrants from Belgium (2.0%, a difference of 0.010%), Argentinean (2.0%, a difference of 0.030%), Immigrants from Saudi Arabia (2.0%, a difference of 0.17%), Somali (2.0%, a difference of 0.24%), and Jordanian (2.0%, a difference of 0.26%). Similarly, the demographic groups most similar to Immigrants from Ethiopia are Eastern European (2.0%, a difference of 0.060%), Immigrants from Indonesia (2.0%, a difference of 0.090%), Ethiopian (2.0%, a difference of 0.11%), Immigrants from Sweden (2.0%, a difference of 0.15%), and Cypriot (2.0%, a difference of 0.16%).
| Demographics | Rating | Rank | Vision Disability |
| Cypriots | 99.7 /100 | #41 | Exceptional 2.0% |
| Immigrants | Ethiopia | 99.7 /100 | #42 | Exceptional 2.0% |
| Eastern Europeans | 99.7 /100 | #43 | Exceptional 2.0% |
| Immigrants | Indonesia | 99.7 /100 | #44 | Exceptional 2.0% |
| Ethiopians | 99.7 /100 | #45 | Exceptional 2.0% |
| Immigrants | Sweden | 99.7 /100 | #46 | Exceptional 2.0% |
| Immigrants | Bulgaria | 99.7 /100 | #47 | Exceptional 2.0% |
| Israelis | 99.6 /100 | #48 | Exceptional 2.0% |
| Latvians | 99.5 /100 | #49 | Exceptional 2.0% |
| Afghans | 99.5 /100 | #50 | Exceptional 2.0% |
| Tongans | 99.5 /100 | #51 | Exceptional 2.0% |
| Immigrants | Serbia | 99.4 /100 | #52 | Exceptional 2.0% |
| Immigrants | Belarus | 99.3 /100 | #53 | Exceptional 2.0% |
| Macedonians | 99.3 /100 | #54 | Exceptional 2.0% |
| Laotians | 99.3 /100 | #55 | Exceptional 2.0% |
| Jordanians | 99.2 /100 | #56 | Exceptional 2.0% |
| Somalis | 99.2 /100 | #57 | Exceptional 2.0% |
| Immigrants | Saudi Arabia | 99.2 /100 | #58 | Exceptional 2.0% |
| Argentineans | 99.1 /100 | #59 | Exceptional 2.0% |
| Immigrants | Romania | 99.1 /100 | #60 | Exceptional 2.0% |
| Immigrants | Belgium | 99.1 /100 | #61 | Exceptional 2.0% |