Immigrants from Ireland vs Somali Cognitive Disability
COMPARE
Immigrants from Ireland
Somali
Cognitive Disability
Cognitive Disability Comparison
Immigrants from Ireland
Somalis
16.1%
COGNITIVE DISABILITY
100.0/ 100
METRIC RATING
7th/ 347
METRIC RANK
19.8%
COGNITIVE DISABILITY
0.0/ 100
METRIC RATING
345th/ 347
METRIC RANK
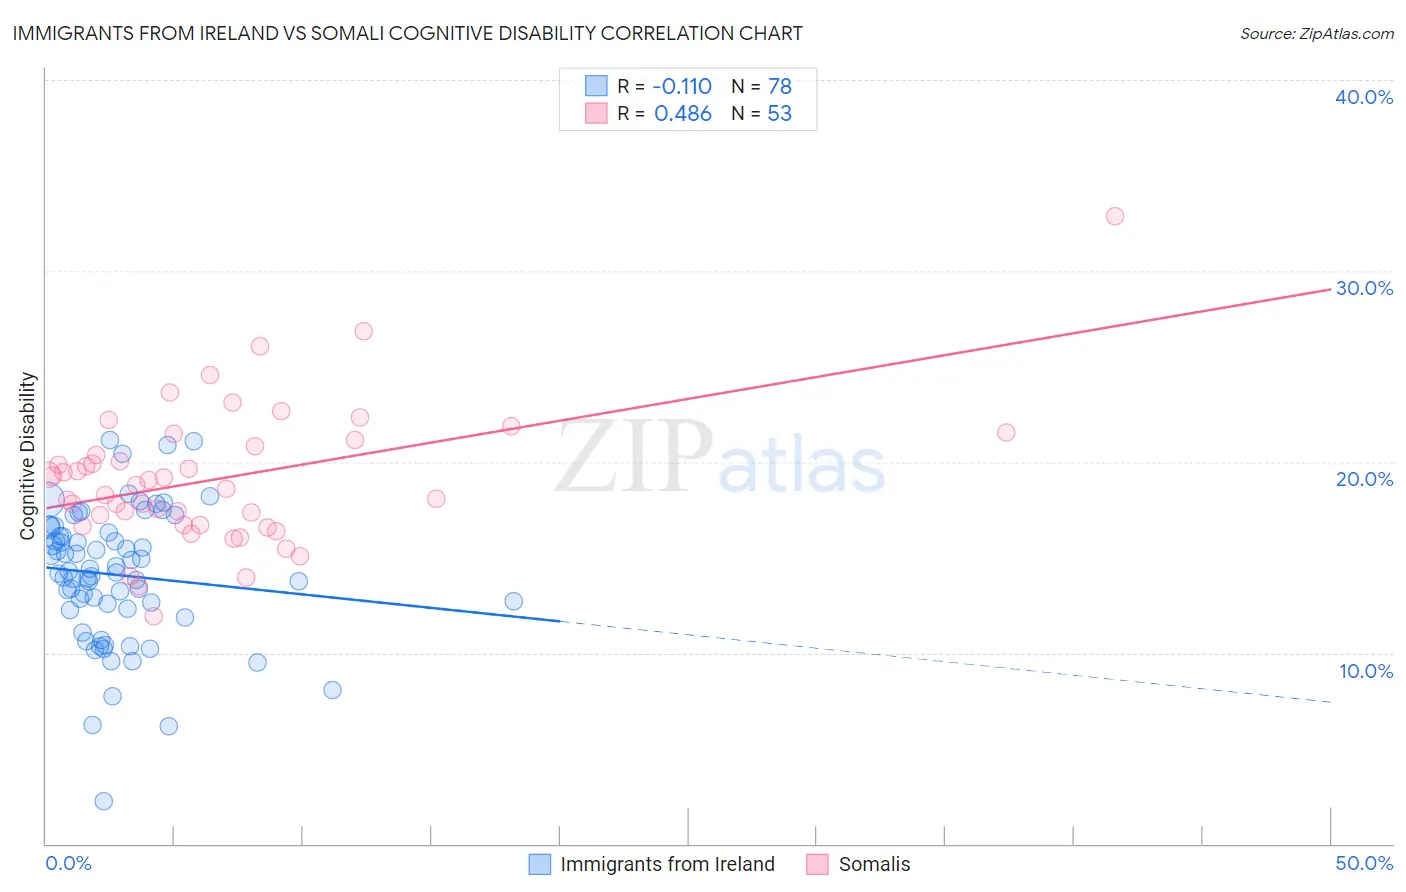
Immigrants from Ireland vs Somali Cognitive Disability Correlation Chart
The statistical analysis conducted on geographies consisting of 240,767,768 people shows a poor negative correlation between the proportion of Immigrants from Ireland and percentage of population with cognitive disability in the United States with a correlation coefficient (R) of -0.110 and weighted average of 16.1%. Similarly, the statistical analysis conducted on geographies consisting of 99,318,466 people shows a moderate positive correlation between the proportion of Somalis and percentage of population with cognitive disability in the United States with a correlation coefficient (R) of 0.486 and weighted average of 19.8%, a difference of 22.9%.
Cognitive Disability Correlation Summary
| Measurement | Immigrants from Ireland | Somali |
| Minimum | 2.2% | 11.9% |
| Maximum | 21.1% | 32.8% |
| Range | 18.9% | 20.9% |
| Mean | 14.1% | 19.1% |
| Median | 14.2% | 18.8% |
| Interquartile 25% (IQ1) | 12.3% | 16.7% |
| Interquartile 75% (IQ3) | 16.3% | 21.0% |
| Interquartile Range (IQR) | 4.0% | 4.3% |
| Standard Deviation (Sample) | 3.5% | 3.6% |
| Standard Deviation (Population) | 3.5% | 3.6% |
Similar Demographics by Cognitive Disability
Demographics Similar to Immigrants from Ireland by Cognitive Disability
In terms of cognitive disability, the demographic groups most similar to Immigrants from Ireland are Immigrants from Poland (16.1%, a difference of 0.020%), Thai (16.1%, a difference of 0.11%), Assyrian/Chaldean/Syriac (16.2%, a difference of 0.34%), Immigrants from Scotland (16.2%, a difference of 0.38%), and Immigrants from Czechoslovakia (16.2%, a difference of 0.47%).
| Demographics | Rating | Rank | Cognitive Disability |
| Immigrants | Taiwan | 100.0 /100 | #1 | Exceptional 15.7% |
| Immigrants | India | 100.0 /100 | #2 | Exceptional 15.9% |
| Chinese | 100.0 /100 | #3 | Exceptional 15.9% |
| Immigrants | Lithuania | 100.0 /100 | #4 | Exceptional 16.0% |
| Immigrants | Hong Kong | 100.0 /100 | #5 | Exceptional 16.0% |
| Thais | 100.0 /100 | #6 | Exceptional 16.1% |
| Immigrants | Ireland | 100.0 /100 | #7 | Exceptional 16.1% |
| Immigrants | Poland | 100.0 /100 | #8 | Exceptional 16.1% |
| Assyrians/Chaldeans/Syriacs | 100.0 /100 | #9 | Exceptional 16.2% |
| Immigrants | Scotland | 100.0 /100 | #10 | Exceptional 16.2% |
| Immigrants | Czechoslovakia | 100.0 /100 | #11 | Exceptional 16.2% |
| Maltese | 100.0 /100 | #12 | Exceptional 16.2% |
| Lithuanians | 100.0 /100 | #13 | Exceptional 16.3% |
| Immigrants | Austria | 100.0 /100 | #14 | Exceptional 16.3% |
| Immigrants | Greece | 100.0 /100 | #15 | Exceptional 16.3% |
Demographics Similar to Somalis by Cognitive Disability
In terms of cognitive disability, the demographic groups most similar to Somalis are Immigrants from Cabo Verde (19.9%, a difference of 0.16%), Immigrants from Congo (19.7%, a difference of 0.56%), Immigrants from Somalia (20.0%, a difference of 0.89%), Immigrants from Zaire (19.4%, a difference of 2.2%), and Tohono O'odham (19.3%, a difference of 2.9%).
| Demographics | Rating | Rank | Cognitive Disability |
| Immigrants | Yemen | 0.0 /100 | #333 | Tragic 18.8% |
| Sudanese | 0.0 /100 | #334 | Tragic 18.9% |
| Senegalese | 0.0 /100 | #335 | Tragic 19.0% |
| Blacks/African Americans | 0.0 /100 | #336 | Tragic 19.0% |
| Immigrants | Saudi Arabia | 0.0 /100 | #337 | Tragic 19.1% |
| Lumbee | 0.0 /100 | #338 | Tragic 19.1% |
| Puerto Ricans | 0.0 /100 | #339 | Tragic 19.2% |
| Cape Verdeans | 0.0 /100 | #340 | Tragic 19.2% |
| Tohono O'odham | 0.0 /100 | #341 | Tragic 19.3% |
| Houma | 0.0 /100 | #342 | Tragic 19.3% |
| Immigrants | Zaire | 0.0 /100 | #343 | Tragic 19.4% |
| Immigrants | Congo | 0.0 /100 | #344 | Tragic 19.7% |
| Somalis | 0.0 /100 | #345 | Tragic 19.8% |
| Immigrants | Cabo Verde | 0.0 /100 | #346 | Tragic 19.9% |
| Immigrants | Somalia | 0.0 /100 | #347 | Tragic 20.0% |