Immigrants from Iraq vs Immigrants from Eastern Asia Female Disability
COMPARE
Immigrants from Iraq
Immigrants from Eastern Asia
Female Disability
Female Disability Comparison
Immigrants from Iraq
Immigrants from Eastern Asia
12.5%
FEMALE DISABILITY
5.3/ 100
METRIC RATING
233rd/ 347
METRIC RANK
10.7%
FEMALE DISABILITY
100.0/ 100
METRIC RATING
13th/ 347
METRIC RANK
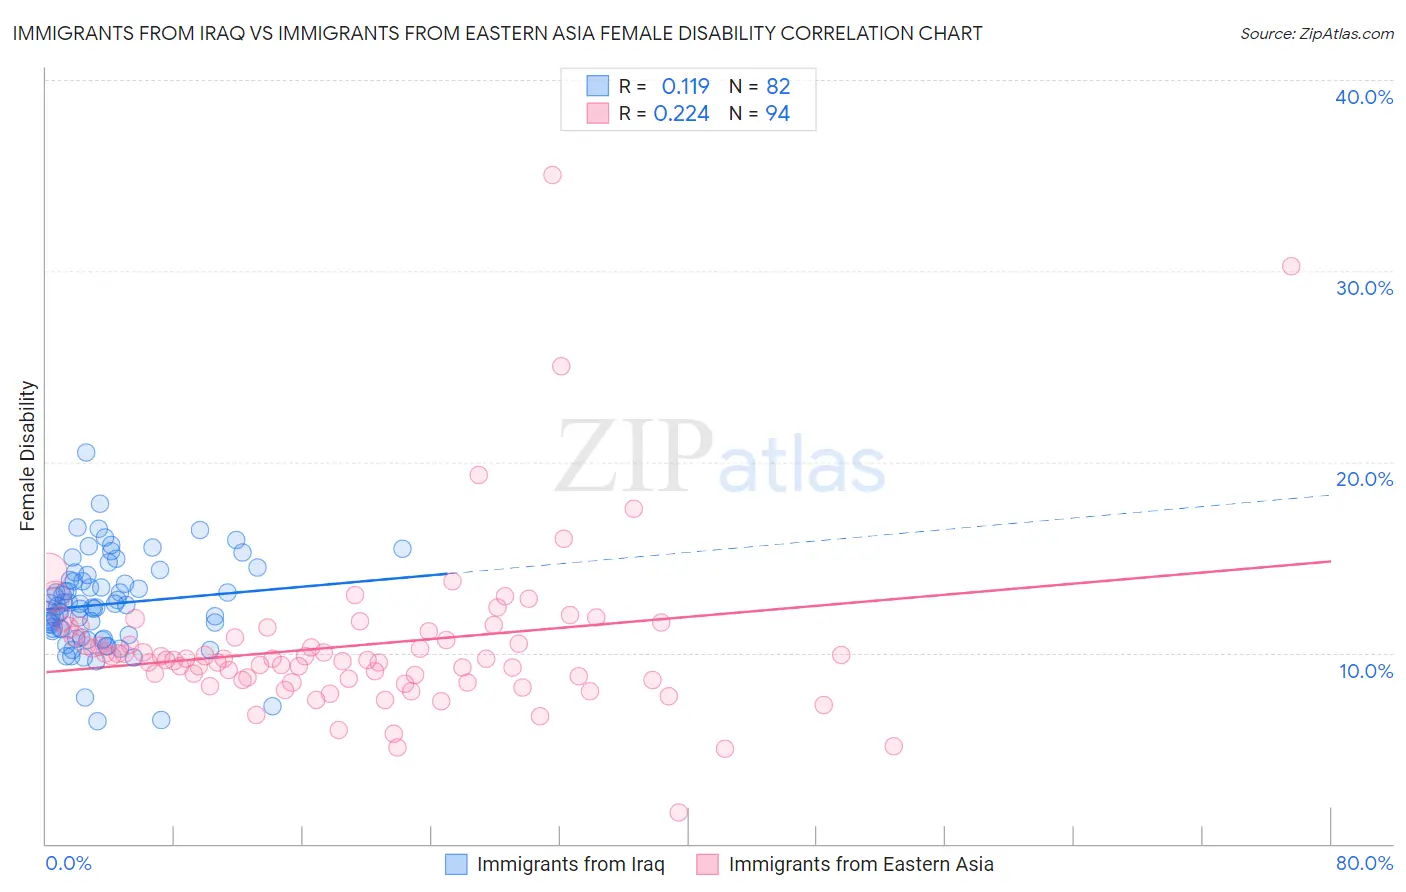
Immigrants from Iraq vs Immigrants from Eastern Asia Female Disability Correlation Chart
The statistical analysis conducted on geographies consisting of 194,760,840 people shows a poor positive correlation between the proportion of Immigrants from Iraq and percentage of females with a disability in the United States with a correlation coefficient (R) of 0.119 and weighted average of 12.5%. Similarly, the statistical analysis conducted on geographies consisting of 499,845,203 people shows a weak positive correlation between the proportion of Immigrants from Eastern Asia and percentage of females with a disability in the United States with a correlation coefficient (R) of 0.224 and weighted average of 10.7%, a difference of 17.2%.
Female Disability Correlation Summary
| Measurement | Immigrants from Iraq | Immigrants from Eastern Asia |
| Minimum | 6.4% | 1.6% |
| Maximum | 20.5% | 35.0% |
| Range | 14.1% | 33.4% |
| Mean | 12.5% | 10.4% |
| Median | 12.5% | 9.7% |
| Interquartile 25% (IQ1) | 10.9% | 8.6% |
| Interquartile 75% (IQ3) | 13.8% | 11.2% |
| Interquartile Range (IQR) | 2.9% | 2.6% |
| Standard Deviation (Sample) | 2.4% | 4.4% |
| Standard Deviation (Population) | 2.4% | 4.4% |
Similar Demographics by Female Disability
Demographics Similar to Immigrants from Iraq by Female Disability
In terms of female disability, the demographic groups most similar to Immigrants from Iraq are Scandinavian (12.5%, a difference of 0.010%), Malaysian (12.5%, a difference of 0.060%), Immigrants from Somalia (12.5%, a difference of 0.10%), Belgian (12.5%, a difference of 0.19%), and Immigrants from West Indies (12.6%, a difference of 0.19%).
| Demographics | Rating | Rank | Female Disability |
| Hispanics or Latinos | 8.0 /100 | #226 | Tragic 12.5% |
| Assyrians/Chaldeans/Syriacs | 8.0 /100 | #227 | Tragic 12.5% |
| Immigrants | Cambodia | 7.8 /100 | #228 | Tragic 12.5% |
| Hungarians | 7.2 /100 | #229 | Tragic 12.5% |
| Immigrants | Belize | 7.0 /100 | #230 | Tragic 12.5% |
| Belgians | 6.5 /100 | #231 | Tragic 12.5% |
| Immigrants | Somalia | 5.9 /100 | #232 | Tragic 12.5% |
| Immigrants | Iraq | 5.3 /100 | #233 | Tragic 12.5% |
| Scandinavians | 5.3 /100 | #234 | Tragic 12.5% |
| Malaysians | 5.0 /100 | #235 | Tragic 12.5% |
| Immigrants | West Indies | 4.4 /100 | #236 | Tragic 12.6% |
| Slavs | 3.8 /100 | #237 | Tragic 12.6% |
| Yugoslavians | 3.7 /100 | #238 | Tragic 12.6% |
| Barbadians | 3.6 /100 | #239 | Tragic 12.6% |
| German Russians | 3.2 /100 | #240 | Tragic 12.6% |
Demographics Similar to Immigrants from Eastern Asia by Female Disability
In terms of female disability, the demographic groups most similar to Immigrants from Eastern Asia are Immigrants from China (10.7%, a difference of 0.040%), Immigrants from Israel (10.7%, a difference of 0.070%), Immigrants from Korea (10.6%, a difference of 0.49%), Burmese (10.7%, a difference of 0.54%), and Okinawan (10.8%, a difference of 0.61%).
| Demographics | Rating | Rank | Female Disability |
| Bolivians | 100.0 /100 | #6 | Exceptional 10.4% |
| Immigrants | Singapore | 100.0 /100 | #7 | Exceptional 10.4% |
| Immigrants | South Central Asia | 100.0 /100 | #8 | Exceptional 10.5% |
| Iranians | 100.0 /100 | #9 | Exceptional 10.6% |
| Immigrants | Hong Kong | 100.0 /100 | #10 | Exceptional 10.6% |
| Immigrants | Korea | 100.0 /100 | #11 | Exceptional 10.6% |
| Immigrants | Israel | 100.0 /100 | #12 | Exceptional 10.7% |
| Immigrants | Eastern Asia | 100.0 /100 | #13 | Exceptional 10.7% |
| Immigrants | China | 100.0 /100 | #14 | Exceptional 10.7% |
| Burmese | 100.0 /100 | #15 | Exceptional 10.7% |
| Okinawans | 100.0 /100 | #16 | Exceptional 10.8% |
| Indians (Asian) | 100.0 /100 | #17 | Exceptional 10.8% |
| Immigrants | Iran | 100.0 /100 | #18 | Exceptional 10.8% |
| Immigrants | Venezuela | 100.0 /100 | #19 | Exceptional 10.9% |
| Immigrants | Pakistan | 100.0 /100 | #20 | Exceptional 10.9% |