Immigrants from Indonesia vs Yaqui 4th Grade
COMPARE
Immigrants from Indonesia
Yaqui
4th Grade
4th Grade Comparison
Immigrants from Indonesia
Yaqui
97.1%
4TH GRADE
1.5/ 100
METRIC RATING
241st/ 347
METRIC RANK
96.9%
4TH GRADE
0.1/ 100
METRIC RATING
276th/ 347
METRIC RANK
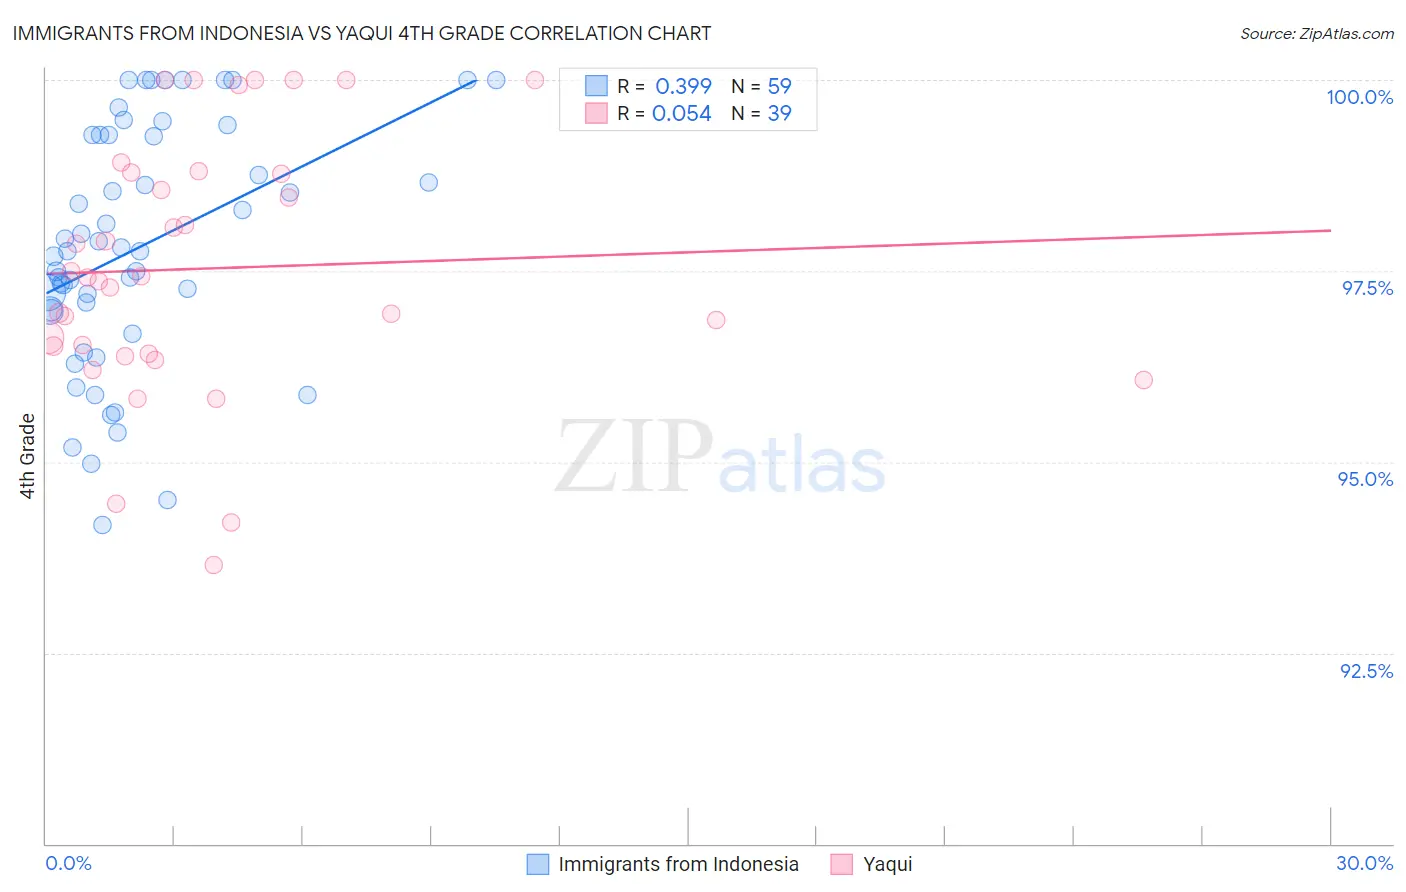
Immigrants from Indonesia vs Yaqui 4th Grade Correlation Chart
The statistical analysis conducted on geographies consisting of 215,782,971 people shows a mild positive correlation between the proportion of Immigrants from Indonesia and percentage of population with at least 4th grade education in the United States with a correlation coefficient (R) of 0.399 and weighted average of 97.1%. Similarly, the statistical analysis conducted on geographies consisting of 107,725,021 people shows a slight positive correlation between the proportion of Yaqui and percentage of population with at least 4th grade education in the United States with a correlation coefficient (R) of 0.054 and weighted average of 96.9%, a difference of 0.26%.
4th Grade Correlation Summary
| Measurement | Immigrants from Indonesia | Yaqui |
| Minimum | 94.2% | 93.6% |
| Maximum | 100.0% | 100.0% |
| Range | 5.8% | 6.4% |
| Mean | 97.8% | 97.5% |
| Median | 97.8% | 97.4% |
| Interquartile 25% (IQ1) | 97.0% | 96.4% |
| Interquartile 75% (IQ3) | 99.3% | 98.8% |
| Interquartile Range (IQR) | 2.3% | 2.4% |
| Standard Deviation (Sample) | 1.6% | 1.7% |
| Standard Deviation (Population) | 1.6% | 1.6% |
Similar Demographics by 4th Grade
Demographics Similar to Immigrants from Indonesia by 4th Grade
In terms of 4th grade, the demographic groups most similar to Immigrants from Indonesia are Colombian (97.1%, a difference of 0.0%), Nigerian (97.1%, a difference of 0.010%), Asian (97.1%, a difference of 0.010%), U.S. Virgin Islander (97.1%, a difference of 0.010%), and Indian (Asian) (97.2%, a difference of 0.020%).
| Demographics | Rating | Rank | 4th Grade |
| Assyrians/Chaldeans/Syriacs | 3.0 /100 | #234 | Tragic 97.2% |
| Yuman | 2.9 /100 | #235 | Tragic 97.2% |
| Immigrants | Eastern Asia | 2.7 /100 | #236 | Tragic 97.2% |
| Immigrants | Costa Rica | 2.0 /100 | #237 | Tragic 97.2% |
| Indians (Asian) | 1.9 /100 | #238 | Tragic 97.2% |
| Nigerians | 1.8 /100 | #239 | Tragic 97.1% |
| Colombians | 1.6 /100 | #240 | Tragic 97.1% |
| Immigrants | Indonesia | 1.5 /100 | #241 | Tragic 97.1% |
| Asians | 1.4 /100 | #242 | Tragic 97.1% |
| U.S. Virgin Islanders | 1.4 /100 | #243 | Tragic 97.1% |
| Koreans | 1.3 /100 | #244 | Tragic 97.1% |
| Immigrants | Eastern Africa | 1.2 /100 | #245 | Tragic 97.1% |
| Immigrants | Uruguay | 1.2 /100 | #246 | Tragic 97.1% |
| Ethiopians | 1.2 /100 | #247 | Tragic 97.1% |
| Immigrants | Asia | 1.2 /100 | #248 | Tragic 97.1% |
Demographics Similar to Yaqui by 4th Grade
In terms of 4th grade, the demographic groups most similar to Yaqui are Immigrants from Ghana (96.9%, a difference of 0.0%), Immigrants from Western Africa (96.9%, a difference of 0.0%), Trinidadian and Tobagonian (96.9%, a difference of 0.010%), Immigrants from Bolivia (96.9%, a difference of 0.010%), and Afghan (96.9%, a difference of 0.010%).
| Demographics | Rating | Rank | 4th Grade |
| Immigrants | Uzbekistan | 0.2 /100 | #269 | Tragic 96.9% |
| Cubans | 0.2 /100 | #270 | Tragic 96.9% |
| Immigrants | Peru | 0.1 /100 | #271 | Tragic 96.9% |
| Fijians | 0.1 /100 | #272 | Tragic 96.9% |
| Immigrants | Cameroon | 0.1 /100 | #273 | Tragic 96.9% |
| Trinidadians and Tobagonians | 0.1 /100 | #274 | Tragic 96.9% |
| Immigrants | Ghana | 0.1 /100 | #275 | Tragic 96.9% |
| Yaqui | 0.1 /100 | #276 | Tragic 96.9% |
| Immigrants | Western Africa | 0.1 /100 | #277 | Tragic 96.9% |
| Immigrants | Bolivia | 0.1 /100 | #278 | Tragic 96.9% |
| Afghans | 0.1 /100 | #279 | Tragic 96.9% |
| Barbadians | 0.1 /100 | #280 | Tragic 96.9% |
| Immigrants | Hong Kong | 0.1 /100 | #281 | Tragic 96.9% |
| Immigrants | Trinidad and Tobago | 0.1 /100 | #282 | Tragic 96.8% |
| Immigrants | Philippines | 0.1 /100 | #283 | Tragic 96.8% |