Immigrants from Argentina vs Yaqui Cognitive Disability
COMPARE
Immigrants from Argentina
Yaqui
Cognitive Disability
Cognitive Disability Comparison
Immigrants from Argentina
Yaqui
16.4%
COGNITIVE DISABILITY
99.9/ 100
METRIC RATING
24th/ 347
METRIC RANK
18.5%
COGNITIVE DISABILITY
0.0/ 100
METRIC RATING
313th/ 347
METRIC RANK
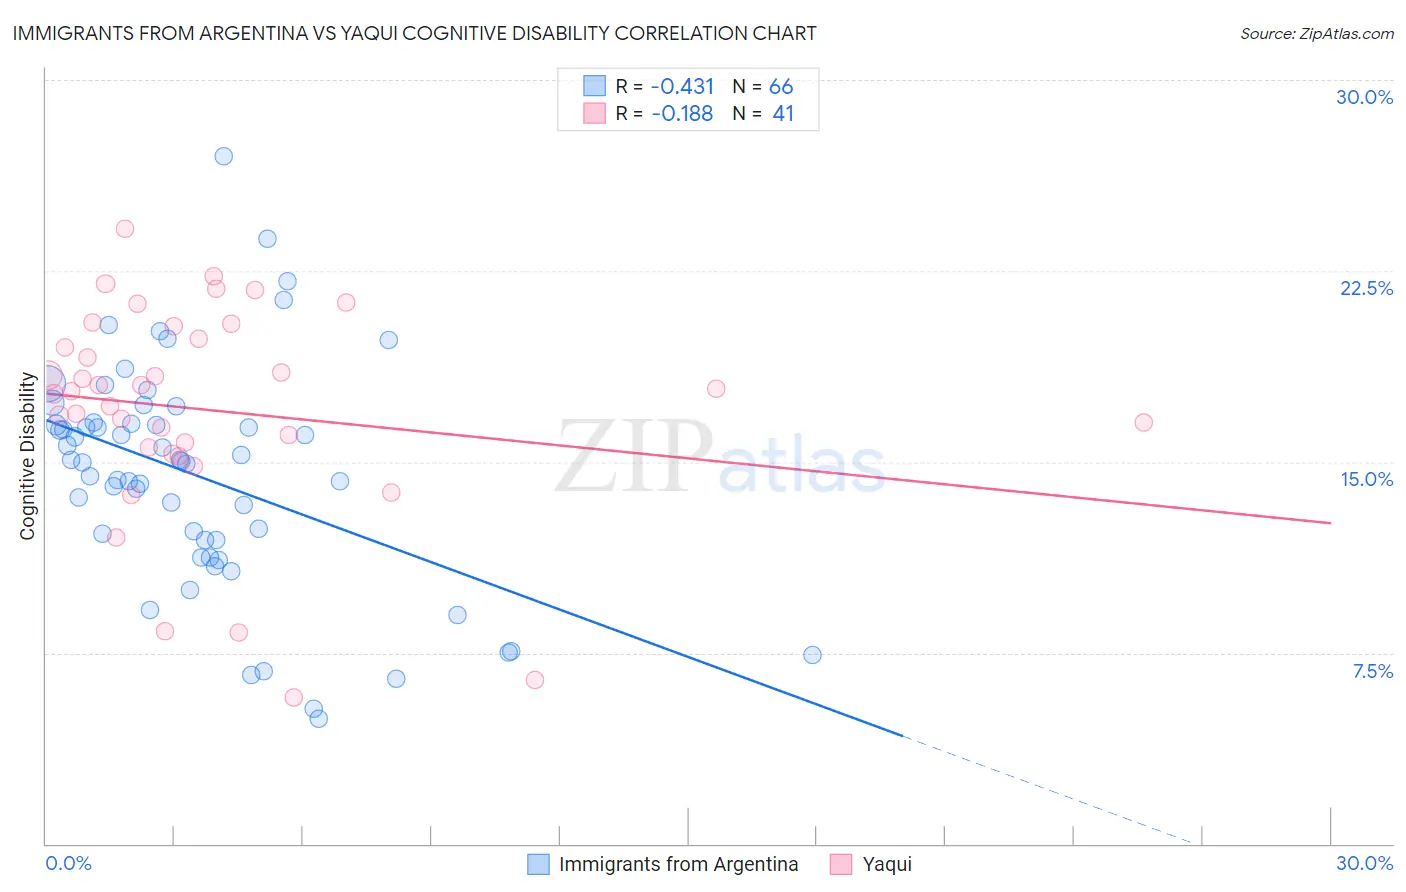
Immigrants from Argentina vs Yaqui Cognitive Disability Correlation Chart
The statistical analysis conducted on geographies consisting of 264,433,945 people shows a moderate negative correlation between the proportion of Immigrants from Argentina and percentage of population with cognitive disability in the United States with a correlation coefficient (R) of -0.431 and weighted average of 16.4%. Similarly, the statistical analysis conducted on geographies consisting of 107,721,250 people shows a poor negative correlation between the proportion of Yaqui and percentage of population with cognitive disability in the United States with a correlation coefficient (R) of -0.188 and weighted average of 18.5%, a difference of 13.1%.
Cognitive Disability Correlation Summary
| Measurement | Immigrants from Argentina | Yaqui |
| Minimum | 4.9% | 5.8% |
| Maximum | 27.0% | 24.2% |
| Range | 22.1% | 18.4% |
| Mean | 14.4% | 17.0% |
| Median | 15.0% | 17.8% |
| Interquartile 25% (IQ1) | 11.9% | 15.4% |
| Interquartile 75% (IQ3) | 16.5% | 20.1% |
| Interquartile Range (IQR) | 4.6% | 4.7% |
| Standard Deviation (Sample) | 4.4% | 4.2% |
| Standard Deviation (Population) | 4.4% | 4.1% |
Similar Demographics by Cognitive Disability
Demographics Similar to Immigrants from Argentina by Cognitive Disability
In terms of cognitive disability, the demographic groups most similar to Immigrants from Argentina are Croatian (16.4%, a difference of 0.030%), Luxembourger (16.4%, a difference of 0.040%), Immigrants from South Central Asia (16.4%, a difference of 0.060%), Immigrants from Croatia (16.4%, a difference of 0.070%), and Immigrants from Pakistan (16.4%, a difference of 0.090%).
| Demographics | Rating | Rank | Cognitive Disability |
| Immigrants | North Macedonia | 100.0 /100 | #17 | Exceptional 16.3% |
| Immigrants | Northern Europe | 100.0 /100 | #18 | Exceptional 16.3% |
| Immigrants | Bolivia | 100.0 /100 | #19 | Exceptional 16.3% |
| Bulgarians | 100.0 /100 | #20 | Exceptional 16.3% |
| Immigrants | Cuba | 100.0 /100 | #21 | Exceptional 16.3% |
| Immigrants | South Central Asia | 99.9 /100 | #22 | Exceptional 16.4% |
| Croatians | 99.9 /100 | #23 | Exceptional 16.4% |
| Immigrants | Argentina | 99.9 /100 | #24 | Exceptional 16.4% |
| Luxembourgers | 99.9 /100 | #25 | Exceptional 16.4% |
| Immigrants | Croatia | 99.9 /100 | #26 | Exceptional 16.4% |
| Immigrants | Pakistan | 99.9 /100 | #27 | Exceptional 16.4% |
| Poles | 99.9 /100 | #28 | Exceptional 16.4% |
| Filipinos | 99.9 /100 | #29 | Exceptional 16.4% |
| Czechs | 99.9 /100 | #30 | Exceptional 16.4% |
| Immigrants | Romania | 99.9 /100 | #31 | Exceptional 16.4% |
Demographics Similar to Yaqui by Cognitive Disability
In terms of cognitive disability, the demographic groups most similar to Yaqui are Subsaharan African (18.5%, a difference of 0.060%), Chickasaw (18.5%, a difference of 0.11%), Immigrants from Dominica (18.6%, a difference of 0.24%), Immigrants from Middle Africa (18.6%, a difference of 0.32%), and Hmong (18.4%, a difference of 0.39%).
| Demographics | Rating | Rank | Cognitive Disability |
| Seminole | 0.0 /100 | #306 | Tragic 18.3% |
| Ugandans | 0.0 /100 | #307 | Tragic 18.3% |
| Immigrants | Western Africa | 0.0 /100 | #308 | Tragic 18.4% |
| Immigrants | Eastern Africa | 0.0 /100 | #309 | Tragic 18.4% |
| Choctaw | 0.0 /100 | #310 | Tragic 18.4% |
| Hmong | 0.0 /100 | #311 | Tragic 18.4% |
| Chickasaw | 0.0 /100 | #312 | Tragic 18.5% |
| Yaqui | 0.0 /100 | #313 | Tragic 18.5% |
| Sub-Saharan Africans | 0.0 /100 | #314 | Tragic 18.5% |
| Immigrants | Dominica | 0.0 /100 | #315 | Tragic 18.6% |
| Immigrants | Middle Africa | 0.0 /100 | #316 | Tragic 18.6% |
| Liberians | 0.0 /100 | #317 | Tragic 18.6% |
| Bangladeshis | 0.0 /100 | #318 | Tragic 18.6% |
| Comanche | 0.0 /100 | #319 | Tragic 18.6% |
| Apache | 0.0 /100 | #320 | Tragic 18.6% |