Immigrants from Hungary vs Immigrants from Morocco Disability Age Under 5
COMPARE
Immigrants from Hungary
Immigrants from Morocco
Disability Age Under 5
Disability Age Under 5 Comparison
Immigrants from Hungary
Immigrants from Morocco
1.4%
DISABILITY AGE UNDER 5
1.0/ 100
METRIC RATING
251st/ 347
METRIC RANK
1.2%
DISABILITY AGE UNDER 5
96.0/ 100
METRIC RATING
102nd/ 347
METRIC RANK
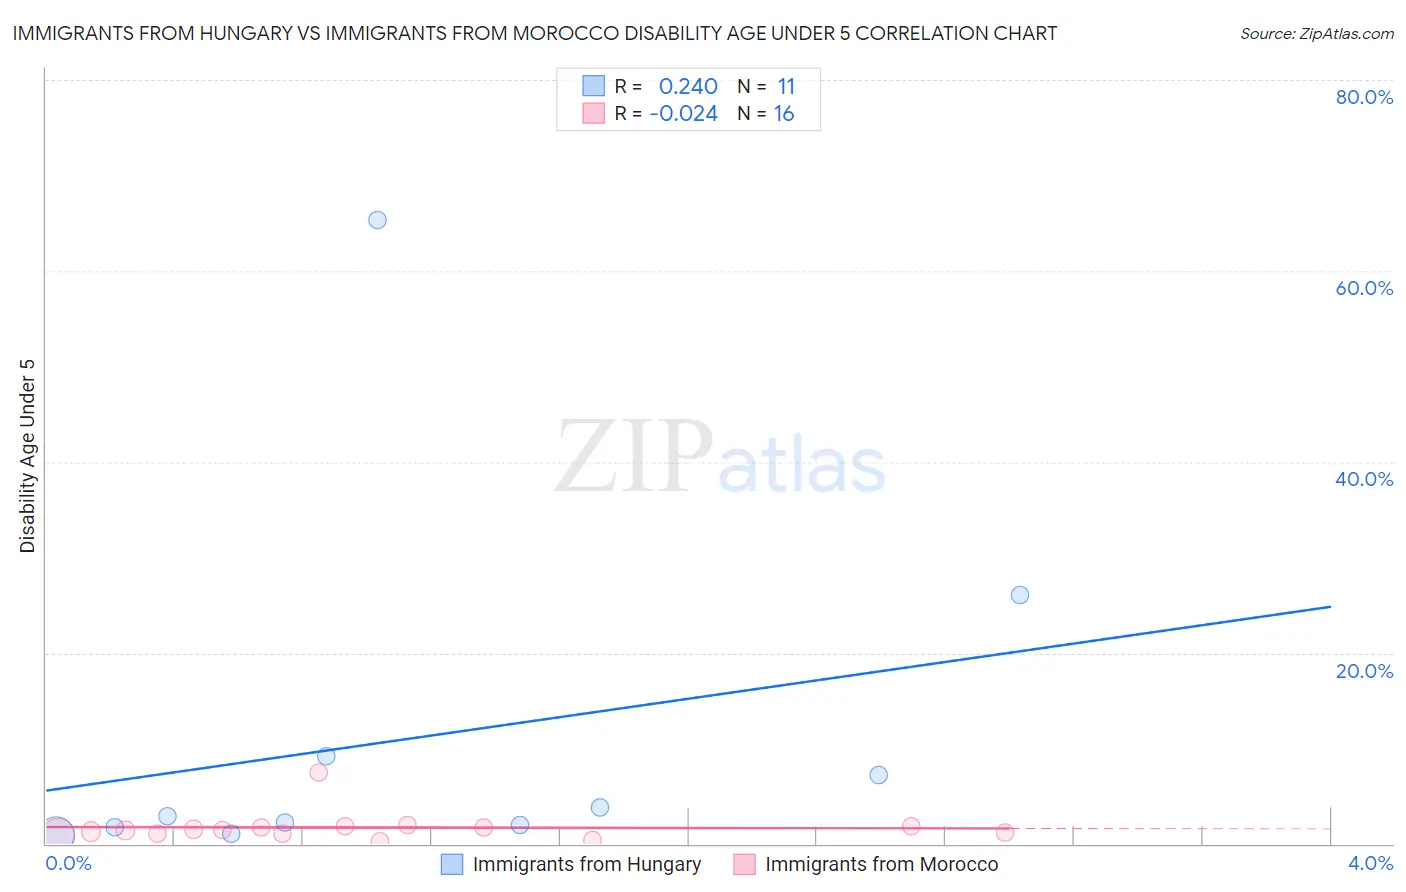
Immigrants from Hungary vs Immigrants from Morocco Disability Age Under 5 Correlation Chart
The statistical analysis conducted on geographies consisting of 126,295,139 people shows a weak positive correlation between the proportion of Immigrants from Hungary and percentage of population with a disability under the age of 5 in the United States with a correlation coefficient (R) of 0.240 and weighted average of 1.4%. Similarly, the statistical analysis conducted on geographies consisting of 120,271,602 people shows no correlation between the proportion of Immigrants from Morocco and percentage of population with a disability under the age of 5 in the United States with a correlation coefficient (R) of -0.024 and weighted average of 1.2%, a difference of 19.1%.
Disability Age Under 5 Correlation Summary
| Measurement | Immigrants from Hungary | Immigrants from Morocco |
| Minimum | 0.96% | 0.32% |
| Maximum | 65.4% | 7.4% |
| Range | 64.4% | 7.1% |
| Mean | 11.1% | 1.7% |
| Median | 2.9% | 1.4% |
| Interquartile 25% (IQ1) | 1.8% | 1.1% |
| Interquartile 75% (IQ3) | 9.2% | 1.8% |
| Interquartile Range (IQR) | 7.4% | 0.68% |
| Standard Deviation (Sample) | 19.4% | 1.6% |
| Standard Deviation (Population) | 18.5% | 1.6% |
Similar Demographics by Disability Age Under 5
Demographics Similar to Immigrants from Hungary by Disability Age Under 5
In terms of disability age under 5, the demographic groups most similar to Immigrants from Hungary are African (1.4%, a difference of 0.030%), Bermudan (1.4%, a difference of 0.040%), Immigrants from Scotland (1.4%, a difference of 0.040%), Eastern European (1.4%, a difference of 0.12%), and Immigrants from England (1.4%, a difference of 0.15%).
| Demographics | Rating | Rank | Disability Age Under 5 |
| Spaniards | 1.4 /100 | #244 | Tragic 1.4% |
| Potawatomi | 1.1 /100 | #245 | Tragic 1.4% |
| Russians | 1.0 /100 | #246 | Tragic 1.4% |
| Immigrants | England | 1.0 /100 | #247 | Tragic 1.4% |
| Eastern Europeans | 1.0 /100 | #248 | Tragic 1.4% |
| Bermudans | 1.0 /100 | #249 | Tragic 1.4% |
| Africans | 1.0 /100 | #250 | Tragic 1.4% |
| Immigrants | Hungary | 1.0 /100 | #251 | Tragic 1.4% |
| Immigrants | Scotland | 0.9 /100 | #252 | Tragic 1.4% |
| Australians | 0.7 /100 | #253 | Tragic 1.4% |
| Immigrants | Brazil | 0.7 /100 | #254 | Tragic 1.4% |
| Immigrants | Liberia | 0.6 /100 | #255 | Tragic 1.4% |
| Immigrants | Western Europe | 0.5 /100 | #256 | Tragic 1.4% |
| Slovenes | 0.3 /100 | #257 | Tragic 1.4% |
| Costa Ricans | 0.3 /100 | #258 | Tragic 1.4% |
Demographics Similar to Immigrants from Morocco by Disability Age Under 5
In terms of disability age under 5, the demographic groups most similar to Immigrants from Morocco are Immigrants from Nicaragua (1.2%, a difference of 0.0%), Immigrants from Uganda (1.1%, a difference of 0.060%), Indonesian (1.2%, a difference of 0.070%), Nicaraguan (1.1%, a difference of 0.17%), and Dominican (1.1%, a difference of 0.20%).
| Demographics | Rating | Rank | Disability Age Under 5 |
| Immigrants | Moldova | 96.8 /100 | #95 | Exceptional 1.1% |
| Mongolians | 96.6 /100 | #96 | Exceptional 1.1% |
| Immigrants | Iraq | 96.5 /100 | #97 | Exceptional 1.1% |
| Immigrants | South Eastern Asia | 96.5 /100 | #98 | Exceptional 1.1% |
| Dominicans | 96.3 /100 | #99 | Exceptional 1.1% |
| Nicaraguans | 96.3 /100 | #100 | Exceptional 1.1% |
| Immigrants | Uganda | 96.1 /100 | #101 | Exceptional 1.1% |
| Immigrants | Morocco | 96.0 /100 | #102 | Exceptional 1.2% |
| Immigrants | Nicaragua | 96.0 /100 | #103 | Exceptional 1.2% |
| Indonesians | 95.9 /100 | #104 | Exceptional 1.2% |
| Immigrants | South Africa | 95.6 /100 | #105 | Exceptional 1.2% |
| Cambodians | 95.4 /100 | #106 | Exceptional 1.2% |
| Immigrants | West Indies | 95.3 /100 | #107 | Exceptional 1.2% |
| Iraqis | 95.1 /100 | #108 | Exceptional 1.2% |
| Immigrants | Panama | 95.0 /100 | #109 | Exceptional 1.2% |