Immigrants from Hungary vs Belizean Disability Age Under 5
COMPARE
Immigrants from Hungary
Belizean
Disability Age Under 5
Disability Age Under 5 Comparison
Immigrants from Hungary
Belizeans
1.4%
DISABILITY AGE UNDER 5
1.0/ 100
METRIC RATING
251st/ 347
METRIC RANK
1.2%
DISABILITY AGE UNDER 5
93.9/ 100
METRIC RATING
114th/ 347
METRIC RANK
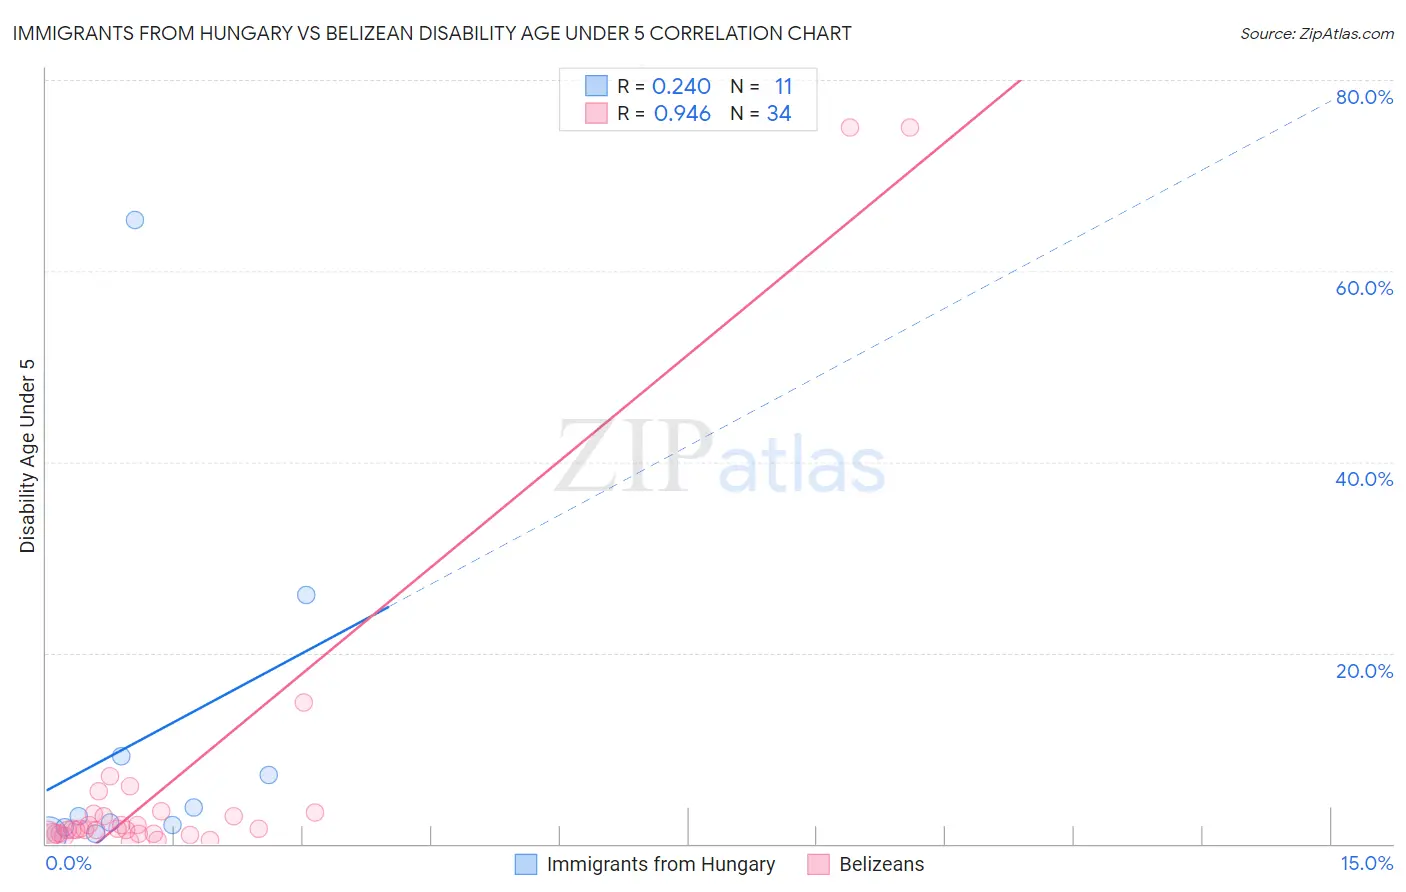
Immigrants from Hungary vs Belizean Disability Age Under 5 Correlation Chart
The statistical analysis conducted on geographies consisting of 126,295,139 people shows a weak positive correlation between the proportion of Immigrants from Hungary and percentage of population with a disability under the age of 5 in the United States with a correlation coefficient (R) of 0.240 and weighted average of 1.4%. Similarly, the statistical analysis conducted on geographies consisting of 106,629,681 people shows a near-perfect positive correlation between the proportion of Belizeans and percentage of population with a disability under the age of 5 in the United States with a correlation coefficient (R) of 0.946 and weighted average of 1.2%, a difference of 17.7%.
Disability Age Under 5 Correlation Summary
| Measurement | Immigrants from Hungary | Belizean |
| Minimum | 0.96% | 0.27% |
| Maximum | 65.4% | 75.0% |
| Range | 64.4% | 74.7% |
| Mean | 11.1% | 6.7% |
| Median | 2.9% | 1.5% |
| Interquartile 25% (IQ1) | 1.8% | 1.0% |
| Interquartile 75% (IQ3) | 9.2% | 3.1% |
| Interquartile Range (IQR) | 7.4% | 2.1% |
| Standard Deviation (Sample) | 19.4% | 17.5% |
| Standard Deviation (Population) | 18.5% | 17.3% |
Similar Demographics by Disability Age Under 5
Demographics Similar to Immigrants from Hungary by Disability Age Under 5
In terms of disability age under 5, the demographic groups most similar to Immigrants from Hungary are African (1.4%, a difference of 0.030%), Bermudan (1.4%, a difference of 0.040%), Immigrants from Scotland (1.4%, a difference of 0.040%), Eastern European (1.4%, a difference of 0.12%), and Immigrants from England (1.4%, a difference of 0.15%).
| Demographics | Rating | Rank | Disability Age Under 5 |
| Spaniards | 1.4 /100 | #244 | Tragic 1.4% |
| Potawatomi | 1.1 /100 | #245 | Tragic 1.4% |
| Russians | 1.0 /100 | #246 | Tragic 1.4% |
| Immigrants | England | 1.0 /100 | #247 | Tragic 1.4% |
| Eastern Europeans | 1.0 /100 | #248 | Tragic 1.4% |
| Bermudans | 1.0 /100 | #249 | Tragic 1.4% |
| Africans | 1.0 /100 | #250 | Tragic 1.4% |
| Immigrants | Hungary | 1.0 /100 | #251 | Tragic 1.4% |
| Immigrants | Scotland | 0.9 /100 | #252 | Tragic 1.4% |
| Australians | 0.7 /100 | #253 | Tragic 1.4% |
| Immigrants | Brazil | 0.7 /100 | #254 | Tragic 1.4% |
| Immigrants | Liberia | 0.6 /100 | #255 | Tragic 1.4% |
| Immigrants | Western Europe | 0.5 /100 | #256 | Tragic 1.4% |
| Slovenes | 0.3 /100 | #257 | Tragic 1.4% |
| Costa Ricans | 0.3 /100 | #258 | Tragic 1.4% |
Demographics Similar to Belizeans by Disability Age Under 5
In terms of disability age under 5, the demographic groups most similar to Belizeans are Immigrants from Caribbean (1.2%, a difference of 0.010%), Immigrants from Northern Africa (1.2%, a difference of 0.030%), Immigrants from Oceania (1.2%, a difference of 0.15%), Immigrants from Philippines (1.2%, a difference of 0.17%), and Immigrants from Venezuela (1.2%, a difference of 0.20%).
| Demographics | Rating | Rank | Disability Age Under 5 |
| Immigrants | West Indies | 95.3 /100 | #107 | Exceptional 1.2% |
| Iraqis | 95.1 /100 | #108 | Exceptional 1.2% |
| Immigrants | Panama | 95.0 /100 | #109 | Exceptional 1.2% |
| Immigrants | Lebanon | 95.0 /100 | #110 | Exceptional 1.2% |
| Senegalese | 94.6 /100 | #111 | Exceptional 1.2% |
| Immigrants | Australia | 94.4 /100 | #112 | Exceptional 1.2% |
| Immigrants | Oceania | 94.2 /100 | #113 | Exceptional 1.2% |
| Belizeans | 93.9 /100 | #114 | Exceptional 1.2% |
| Immigrants | Caribbean | 93.8 /100 | #115 | Exceptional 1.2% |
| Immigrants | Northern Africa | 93.8 /100 | #116 | Exceptional 1.2% |
| Immigrants | Philippines | 93.5 /100 | #117 | Exceptional 1.2% |
| Immigrants | Venezuela | 93.4 /100 | #118 | Exceptional 1.2% |
| Bhutanese | 92.5 /100 | #119 | Exceptional 1.2% |
| Immigrants | Eritrea | 92.3 /100 | #120 | Exceptional 1.2% |
| Immigrants | Senegal | 91.4 /100 | #121 | Exceptional 1.2% |