Immigrants from Hong Kong vs Immigrants from Latin America Disability
COMPARE
Immigrants from Hong Kong
Immigrants from Latin America
Disability
Disability Comparison
Immigrants from Hong Kong
Immigrants from Latin America
10.0%
DISABILITY
100.0/ 100
METRIC RATING
9th/ 347
METRIC RANK
11.7%
DISABILITY
54.1/ 100
METRIC RATING
168th/ 347
METRIC RANK
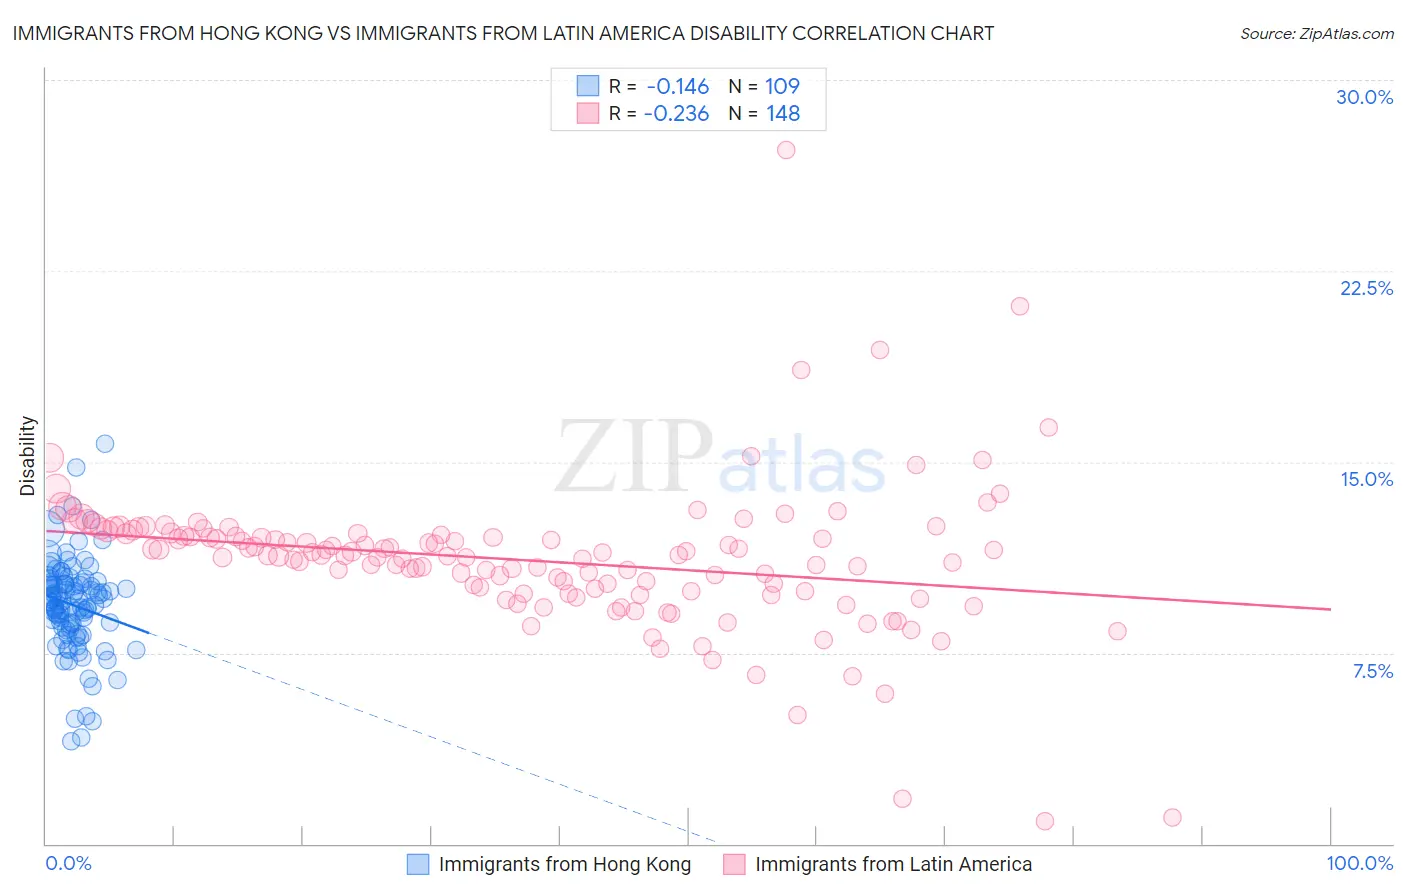
Immigrants from Hong Kong vs Immigrants from Latin America Disability Correlation Chart
The statistical analysis conducted on geographies consisting of 253,995,136 people shows a poor negative correlation between the proportion of Immigrants from Hong Kong and percentage of population with a disability in the United States with a correlation coefficient (R) of -0.146 and weighted average of 10.0%. Similarly, the statistical analysis conducted on geographies consisting of 558,476,645 people shows a weak negative correlation between the proportion of Immigrants from Latin America and percentage of population with a disability in the United States with a correlation coefficient (R) of -0.236 and weighted average of 11.7%, a difference of 16.4%.
Disability Correlation Summary
| Measurement | Immigrants from Hong Kong | Immigrants from Latin America |
| Minimum | 4.0% | 0.89% |
| Maximum | 15.7% | 27.3% |
| Range | 11.7% | 26.4% |
| Mean | 9.4% | 11.1% |
| Median | 9.5% | 11.3% |
| Interquartile 25% (IQ1) | 8.5% | 9.9% |
| Interquartile 75% (IQ3) | 10.2% | 12.1% |
| Interquartile Range (IQR) | 1.8% | 2.2% |
| Standard Deviation (Sample) | 1.9% | 2.9% |
| Standard Deviation (Population) | 1.9% | 2.9% |
Similar Demographics by Disability
Demographics Similar to Immigrants from Hong Kong by Disability
In terms of disability, the demographic groups most similar to Immigrants from Hong Kong are Bolivian (10.0%, a difference of 0.30%), Immigrants from Singapore (10.0%, a difference of 0.52%), Immigrants from China (10.1%, a difference of 0.81%), Iranian (10.1%, a difference of 0.82%), and Immigrants from South Central Asia (9.9%, a difference of 0.84%).
| Demographics | Rating | Rank | Disability |
| Filipinos | 100.0 /100 | #2 | Exceptional 9.6% |
| Immigrants | Taiwan | 100.0 /100 | #3 | Exceptional 9.6% |
| Thais | 100.0 /100 | #4 | Exceptional 9.7% |
| Immigrants | Bolivia | 100.0 /100 | #5 | Exceptional 9.9% |
| Immigrants | South Central Asia | 100.0 /100 | #6 | Exceptional 9.9% |
| Immigrants | Singapore | 100.0 /100 | #7 | Exceptional 10.0% |
| Bolivians | 100.0 /100 | #8 | Exceptional 10.0% |
| Immigrants | Hong Kong | 100.0 /100 | #9 | Exceptional 10.0% |
| Immigrants | China | 100.0 /100 | #10 | Exceptional 10.1% |
| Iranians | 100.0 /100 | #11 | Exceptional 10.1% |
| Immigrants | Israel | 100.0 /100 | #12 | Exceptional 10.1% |
| Immigrants | Eastern Asia | 100.0 /100 | #13 | Exceptional 10.2% |
| Immigrants | Korea | 100.0 /100 | #14 | Exceptional 10.2% |
| Okinawans | 100.0 /100 | #15 | Exceptional 10.3% |
| Indians (Asian) | 100.0 /100 | #16 | Exceptional 10.3% |
Demographics Similar to Immigrants from Latin America by Disability
In terms of disability, the demographic groups most similar to Immigrants from Latin America are Estonian (11.7%, a difference of 0.020%), Pakistani (11.7%, a difference of 0.030%), Immigrants from Austria (11.7%, a difference of 0.030%), Immigrants from Albania (11.7%, a difference of 0.060%), and Immigrants from Southern Europe (11.7%, a difference of 0.060%).
| Demographics | Rating | Rank | Disability |
| Immigrants | Cuba | 62.8 /100 | #161 | Good 11.6% |
| Immigrants | Haiti | 59.2 /100 | #162 | Average 11.7% |
| Immigrants | Trinidad and Tobago | 58.9 /100 | #163 | Average 11.7% |
| Syrians | 58.5 /100 | #164 | Average 11.7% |
| Cubans | 56.7 /100 | #165 | Average 11.7% |
| Pakistanis | 54.7 /100 | #166 | Average 11.7% |
| Estonians | 54.4 /100 | #167 | Average 11.7% |
| Immigrants | Latin America | 54.1 /100 | #168 | Average 11.7% |
| Immigrants | Austria | 53.4 /100 | #169 | Average 11.7% |
| Immigrants | Albania | 52.8 /100 | #170 | Average 11.7% |
| Immigrants | Southern Europe | 52.8 /100 | #171 | Average 11.7% |
| Trinidadians and Tobagonians | 52.7 /100 | #172 | Average 11.7% |
| Maltese | 50.6 /100 | #173 | Average 11.7% |
| Albanians | 50.0 /100 | #174 | Average 11.7% |
| Haitians | 48.6 /100 | #175 | Average 11.7% |