Immigrants from Hong Kong vs French American Indian 1 or more Vehicles in Household
COMPARE
Immigrants from Hong Kong
French American Indian
1 or more Vehicles in Household
1 or more Vehicles in Household Comparison
Immigrants from Hong Kong
French American Indians
88.7%
1 OR MORE VEHICLES IN HOUSEHOLD
6.2/ 100
METRIC RATING
224th/ 347
METRIC RANK
89.8%
1 OR MORE VEHICLES IN HOUSEHOLD
54.4/ 100
METRIC RATING
171st/ 347
METRIC RANK
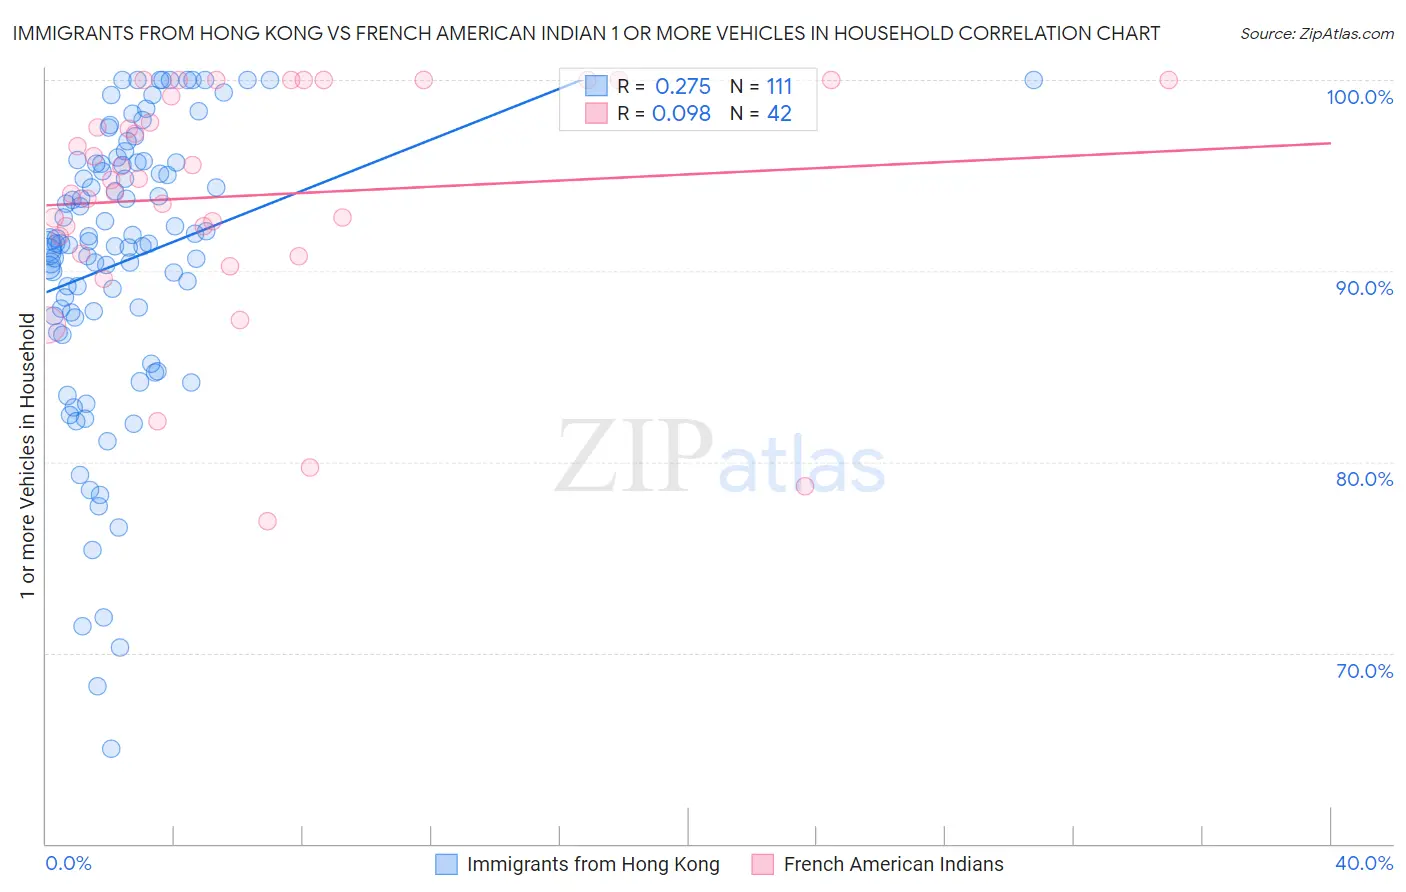
Immigrants from Hong Kong vs French American Indian 1 or more Vehicles in Household Correlation Chart
The statistical analysis conducted on geographies consisting of 243,312,585 people shows a weak positive correlation between the proportion of Immigrants from Hong Kong and percentage of households with 1 or more vehicles available in the United States with a correlation coefficient (R) of 0.275 and weighted average of 88.7%. Similarly, the statistical analysis conducted on geographies consisting of 131,972,990 people shows a slight positive correlation between the proportion of French American Indians and percentage of households with 1 or more vehicles available in the United States with a correlation coefficient (R) of 0.098 and weighted average of 89.8%, a difference of 1.1%.
1 or more Vehicles in Household Correlation Summary
| Measurement | Immigrants from Hong Kong | French American Indian |
| Minimum | 65.0% | 76.9% |
| Maximum | 100.0% | 100.0% |
| Range | 35.0% | 23.1% |
| Mean | 90.5% | 93.9% |
| Median | 91.4% | 94.8% |
| Interquartile 25% (IQ1) | 87.7% | 91.8% |
| Interquartile 75% (IQ3) | 95.7% | 100.0% |
| Interquartile Range (IQR) | 8.0% | 8.2% |
| Standard Deviation (Sample) | 7.5% | 6.1% |
| Standard Deviation (Population) | 7.5% | 6.0% |
Similar Demographics by 1 or more Vehicles in Household
Demographics Similar to Immigrants from Hong Kong by 1 or more Vehicles in Household
In terms of 1 or more vehicles in household, the demographic groups most similar to Immigrants from Hong Kong are Cree (88.7%, a difference of 0.010%), Cheyenne (88.7%, a difference of 0.040%), Ute (88.7%, a difference of 0.040%), Uruguayan (88.8%, a difference of 0.050%), and Immigrants from South America (88.8%, a difference of 0.050%).
| Demographics | Rating | Rank | 1 or more Vehicles in Household |
| Argentineans | 8.8 /100 | #217 | Tragic 88.9% |
| Ugandans | 8.7 /100 | #218 | Tragic 88.9% |
| Immigrants | Guatemala | 8.6 /100 | #219 | Tragic 88.9% |
| Immigrants | Zaire | 8.1 /100 | #220 | Tragic 88.8% |
| Peruvians | 7.9 /100 | #221 | Tragic 88.8% |
| Uruguayans | 7.0 /100 | #222 | Tragic 88.8% |
| Immigrants | South America | 7.0 /100 | #223 | Tragic 88.8% |
| Immigrants | Hong Kong | 6.2 /100 | #224 | Tragic 88.7% |
| Cree | 6.0 /100 | #225 | Tragic 88.7% |
| Cheyenne | 5.7 /100 | #226 | Tragic 88.7% |
| Ute | 5.6 /100 | #227 | Tragic 88.7% |
| Immigrants | Norway | 5.5 /100 | #228 | Tragic 88.7% |
| Immigrants | Romania | 5.4 /100 | #229 | Tragic 88.7% |
| Immigrants | Sierra Leone | 5.2 /100 | #230 | Tragic 88.7% |
| Russians | 5.0 /100 | #231 | Tragic 88.7% |
Demographics Similar to French American Indians by 1 or more Vehicles in Household
In terms of 1 or more vehicles in household, the demographic groups most similar to French American Indians are Indonesian (89.7%, a difference of 0.020%), Lumbee (89.7%, a difference of 0.020%), Immigrants from Costa Rica (89.8%, a difference of 0.050%), Filipino (89.7%, a difference of 0.070%), and Native/Alaskan (89.8%, a difference of 0.080%).
| Demographics | Rating | Rank | 1 or more Vehicles in Household |
| Comanche | 63.4 /100 | #164 | Good 89.9% |
| Immigrants | Saudi Arabia | 62.6 /100 | #165 | Good 89.9% |
| Immigrants | Middle Africa | 62.2 /100 | #166 | Good 89.9% |
| Immigrants | Latin America | 60.3 /100 | #167 | Good 89.8% |
| Immigrants | Cambodia | 60.1 /100 | #168 | Good 89.8% |
| Natives/Alaskans | 59.5 /100 | #169 | Average 89.8% |
| Immigrants | Costa Rica | 57.6 /100 | #170 | Average 89.8% |
| French American Indians | 54.4 /100 | #171 | Average 89.8% |
| Indonesians | 53.0 /100 | #172 | Average 89.7% |
| Lumbee | 52.8 /100 | #173 | Average 89.7% |
| Filipinos | 50.0 /100 | #174 | Average 89.7% |
| Immigrants | Burma/Myanmar | 47.6 /100 | #175 | Average 89.7% |
| Immigrants | Sudan | 47.1 /100 | #176 | Average 89.7% |
| Hmong | 45.8 /100 | #177 | Average 89.6% |
| Immigrants | El Salvador | 44.1 /100 | #178 | Average 89.6% |