Immigrants from Hong Kong vs Mongolian Hearing Disability
COMPARE
Immigrants from Hong Kong
Mongolian
Hearing Disability
Hearing Disability Comparison
Immigrants from Hong Kong
Mongolians
2.7%
HEARING DISABILITY
99.2/ 100
METRIC RATING
51st/ 347
METRIC RANK
2.7%
HEARING DISABILITY
97.4/ 100
METRIC RATING
78th/ 347
METRIC RANK
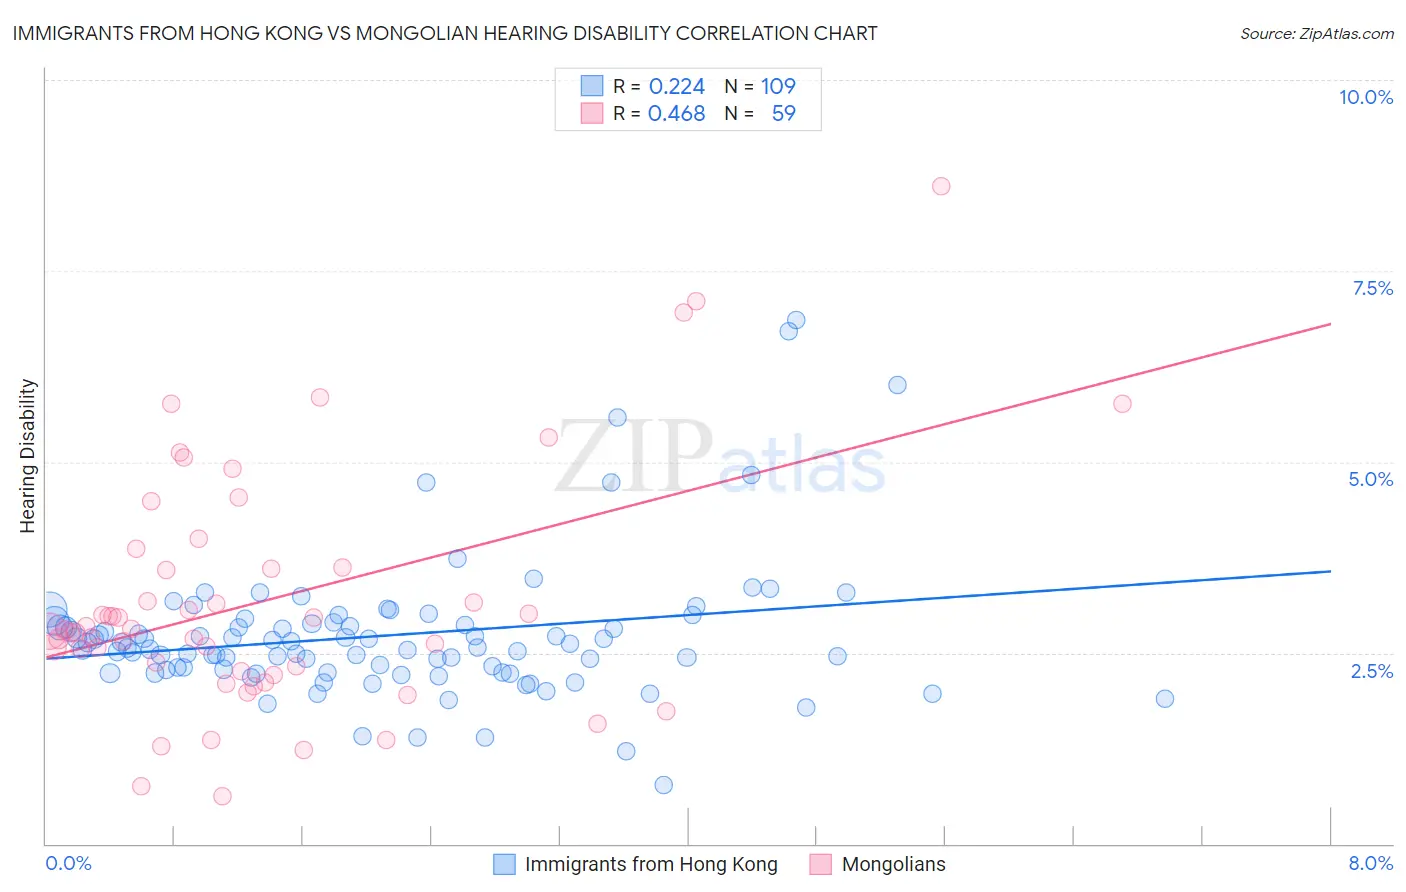
Immigrants from Hong Kong vs Mongolian Hearing Disability Correlation Chart
The statistical analysis conducted on geographies consisting of 253,945,747 people shows a weak positive correlation between the proportion of Immigrants from Hong Kong and percentage of population with hearing disability in the United States with a correlation coefficient (R) of 0.224 and weighted average of 2.7%. Similarly, the statistical analysis conducted on geographies consisting of 140,352,505 people shows a moderate positive correlation between the proportion of Mongolians and percentage of population with hearing disability in the United States with a correlation coefficient (R) of 0.468 and weighted average of 2.7%, a difference of 3.0%.
Hearing Disability Correlation Summary
| Measurement | Immigrants from Hong Kong | Mongolian |
| Minimum | 0.77% | 0.63% |
| Maximum | 6.9% | 8.6% |
| Range | 6.1% | 8.0% |
| Mean | 2.7% | 3.2% |
| Median | 2.6% | 2.8% |
| Interquartile 25% (IQ1) | 2.3% | 2.3% |
| Interquartile 75% (IQ3) | 2.9% | 3.6% |
| Interquartile Range (IQR) | 0.63% | 1.4% |
| Standard Deviation (Sample) | 0.93% | 1.6% |
| Standard Deviation (Population) | 0.92% | 1.6% |
Similar Demographics by Hearing Disability
Demographics Similar to Immigrants from Hong Kong by Hearing Disability
In terms of hearing disability, the demographic groups most similar to Immigrants from Hong Kong are Paraguayan (2.7%, a difference of 0.070%), Immigrants from South America (2.7%, a difference of 0.26%), Jamaican (2.7%, a difference of 0.36%), Immigrants from Singapore (2.6%, a difference of 0.38%), and Immigrants from Eastern Asia (2.7%, a difference of 0.42%).
| Demographics | Rating | Rank | Hearing Disability |
| Nigerians | 99.4 /100 | #44 | Exceptional 2.6% |
| Venezuelans | 99.4 /100 | #45 | Exceptional 2.6% |
| Immigrants | Dominica | 99.3 /100 | #46 | Exceptional 2.6% |
| Immigrants | Israel | 99.3 /100 | #47 | Exceptional 2.6% |
| Immigrants | Singapore | 99.3 /100 | #48 | Exceptional 2.6% |
| Immigrants | South America | 99.2 /100 | #49 | Exceptional 2.7% |
| Paraguayans | 99.2 /100 | #50 | Exceptional 2.7% |
| Immigrants | Hong Kong | 99.2 /100 | #51 | Exceptional 2.7% |
| Jamaicans | 99.0 /100 | #52 | Exceptional 2.7% |
| Immigrants | Eastern Asia | 99.0 /100 | #53 | Exceptional 2.7% |
| Ethiopians | 99.0 /100 | #54 | Exceptional 2.7% |
| Immigrants | Ethiopia | 99.0 /100 | #55 | Exceptional 2.7% |
| Immigrants | Nicaragua | 99.0 /100 | #56 | Exceptional 2.7% |
| South Americans | 99.0 /100 | #57 | Exceptional 2.7% |
| Immigrants | Peru | 98.6 /100 | #58 | Exceptional 2.7% |
Demographics Similar to Mongolians by Hearing Disability
In terms of hearing disability, the demographic groups most similar to Mongolians are Colombian (2.7%, a difference of 0.020%), Immigrants from Malaysia (2.7%, a difference of 0.040%), Immigrants from Saudi Arabia (2.7%, a difference of 0.070%), Asian (2.7%, a difference of 0.070%), and Immigrants from Korea (2.7%, a difference of 0.090%).
| Demographics | Rating | Rank | Hearing Disability |
| Central Americans | 97.7 /100 | #71 | Exceptional 2.7% |
| Afghans | 97.6 /100 | #72 | Exceptional 2.7% |
| Argentineans | 97.5 /100 | #73 | Exceptional 2.7% |
| Immigrants | Korea | 97.5 /100 | #74 | Exceptional 2.7% |
| Immigrants | Saudi Arabia | 97.5 /100 | #75 | Exceptional 2.7% |
| Asians | 97.5 /100 | #76 | Exceptional 2.7% |
| Immigrants | Malaysia | 97.5 /100 | #77 | Exceptional 2.7% |
| Mongolians | 97.4 /100 | #78 | Exceptional 2.7% |
| Colombians | 97.4 /100 | #79 | Exceptional 2.7% |
| Immigrants | Asia | 97.2 /100 | #80 | Exceptional 2.7% |
| Immigrants | Uruguay | 97.2 /100 | #81 | Exceptional 2.7% |
| Immigrants | Armenia | 97.2 /100 | #82 | Exceptional 2.7% |
| Immigrants | Cuba | 97.2 /100 | #83 | Exceptional 2.7% |
| Immigrants | Argentina | 97.0 /100 | #84 | Exceptional 2.8% |
| Immigrants | Northern Africa | 96.9 /100 | #85 | Exceptional 2.8% |