Immigrants from Hong Kong vs Dominican Male Unemployment
COMPARE
Immigrants from Hong Kong
Dominican
Male Unemployment
Male Unemployment Comparison
Immigrants from Hong Kong
Dominicans
5.2%
MALE UNEMPLOYMENT
65.7/ 100
METRIC RATING
163rd/ 347
METRIC RANK
7.6%
MALE UNEMPLOYMENT
0.0/ 100
METRIC RATING
324th/ 347
METRIC RANK
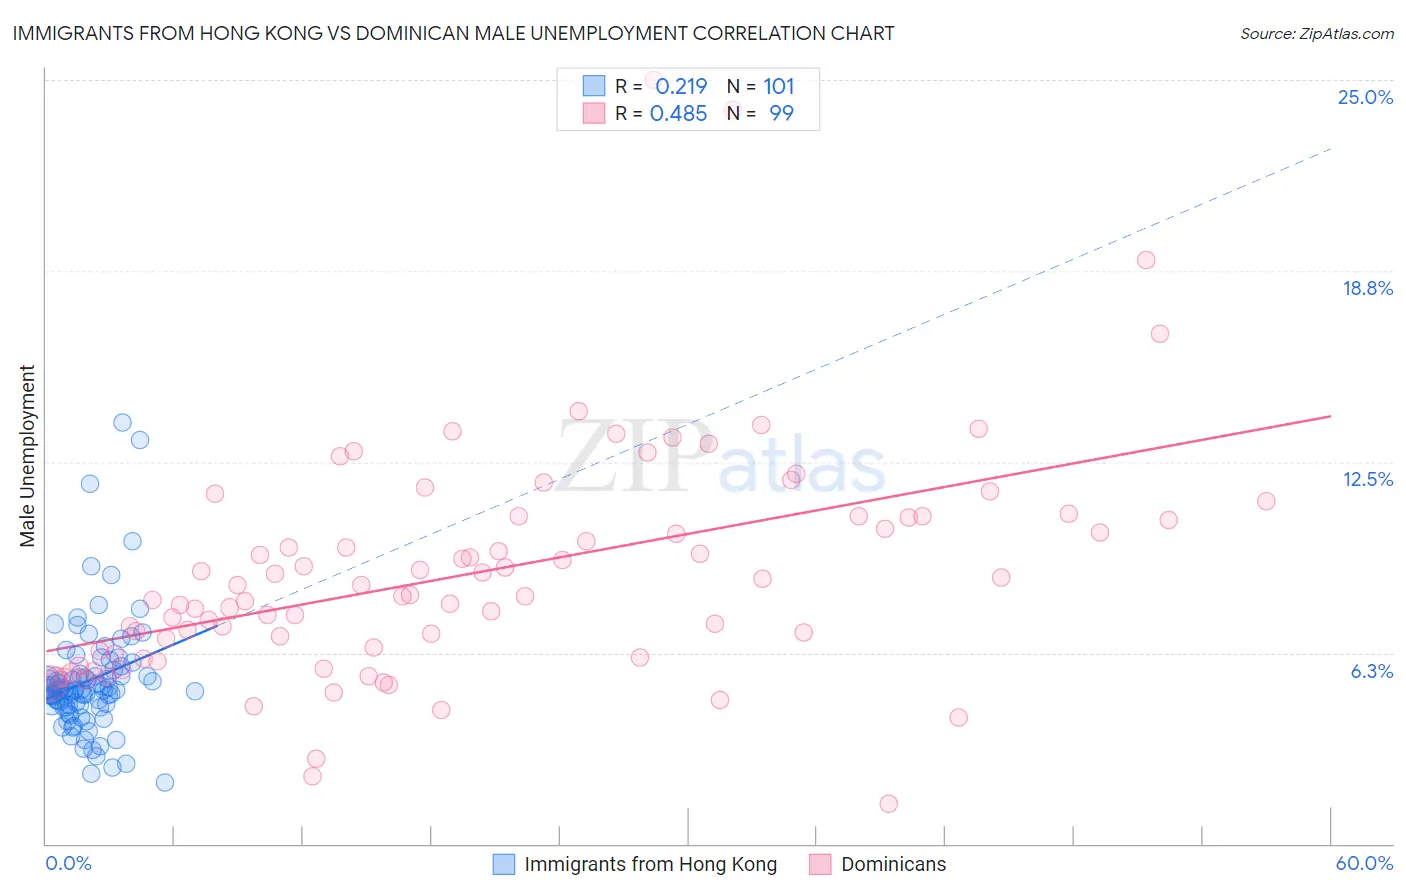
Immigrants from Hong Kong vs Dominican Male Unemployment Correlation Chart
The statistical analysis conducted on geographies consisting of 253,631,392 people shows a weak positive correlation between the proportion of Immigrants from Hong Kong and unemployment rate among males in the United States with a correlation coefficient (R) of 0.219 and weighted average of 5.2%. Similarly, the statistical analysis conducted on geographies consisting of 353,678,027 people shows a moderate positive correlation between the proportion of Dominicans and unemployment rate among males in the United States with a correlation coefficient (R) of 0.485 and weighted average of 7.6%, a difference of 44.4%.
Male Unemployment Correlation Summary
| Measurement | Immigrants from Hong Kong | Dominican |
| Minimum | 2.0% | 1.3% |
| Maximum | 13.8% | 25.0% |
| Range | 11.8% | 23.7% |
| Mean | 5.3% | 8.9% |
| Median | 5.0% | 8.1% |
| Interquartile 25% (IQ1) | 4.5% | 6.2% |
| Interquartile 75% (IQ3) | 5.5% | 10.7% |
| Interquartile Range (IQR) | 0.99% | 4.5% |
| Standard Deviation (Sample) | 1.9% | 3.8% |
| Standard Deviation (Population) | 1.9% | 3.8% |
Similar Demographics by Male Unemployment
Demographics Similar to Immigrants from Hong Kong by Male Unemployment
In terms of male unemployment, the demographic groups most similar to Immigrants from Hong Kong are Immigrants from Egypt (5.2%, a difference of 0.010%), Afghan (5.3%, a difference of 0.24%), South American (5.3%, a difference of 0.32%), Immigrants from China (5.2%, a difference of 0.34%), and Immigrants from Morocco (5.3%, a difference of 0.35%).
| Demographics | Rating | Rank | Male Unemployment |
| Americans | 72.7 /100 | #156 | Good 5.2% |
| Immigrants | Northern Africa | 72.3 /100 | #157 | Good 5.2% |
| Immigrants | Indonesia | 71.5 /100 | #158 | Good 5.2% |
| Indonesians | 71.2 /100 | #159 | Good 5.2% |
| Immigrants | Norway | 71.0 /100 | #160 | Good 5.2% |
| Immigrants | China | 70.6 /100 | #161 | Good 5.2% |
| Immigrants | Egypt | 65.9 /100 | #162 | Good 5.2% |
| Immigrants | Hong Kong | 65.7 /100 | #163 | Good 5.2% |
| Afghans | 62.0 /100 | #164 | Good 5.3% |
| South Americans | 60.6 /100 | #165 | Good 5.3% |
| Immigrants | Morocco | 60.2 /100 | #166 | Good 5.3% |
| Immigrants | Vietnam | 58.1 /100 | #167 | Average 5.3% |
| Immigrants | Ireland | 57.7 /100 | #168 | Average 5.3% |
| Immigrants | Congo | 57.4 /100 | #169 | Average 5.3% |
| Immigrants | Eastern Europe | 54.1 /100 | #170 | Average 5.3% |
Demographics Similar to Dominicans by Male Unemployment
In terms of male unemployment, the demographic groups most similar to Dominicans are Immigrants from Grenada (7.6%, a difference of 0.27%), Shoshone (7.6%, a difference of 0.37%), Immigrants from Dominican Republic (7.6%, a difference of 0.48%), Immigrants from Cabo Verde (7.5%, a difference of 1.1%), and Immigrants from St. Vincent and the Grenadines (7.5%, a difference of 1.4%).
| Demographics | Rating | Rank | Male Unemployment |
| Guyanese | 0.0 /100 | #317 | Tragic 7.1% |
| Cape Verdeans | 0.0 /100 | #318 | Tragic 7.1% |
| British West Indians | 0.0 /100 | #319 | Tragic 7.3% |
| Colville | 0.0 /100 | #320 | Tragic 7.4% |
| Immigrants | St. Vincent and the Grenadines | 0.0 /100 | #321 | Tragic 7.5% |
| Immigrants | Cabo Verde | 0.0 /100 | #322 | Tragic 7.5% |
| Immigrants | Grenada | 0.0 /100 | #323 | Tragic 7.6% |
| Dominicans | 0.0 /100 | #324 | Tragic 7.6% |
| Shoshone | 0.0 /100 | #325 | Tragic 7.6% |
| Immigrants | Dominican Republic | 0.0 /100 | #326 | Tragic 7.6% |
| Paiute | 0.0 /100 | #327 | Tragic 7.7% |
| Natives/Alaskans | 0.0 /100 | #328 | Tragic 7.7% |
| Immigrants | Yemen | 0.0 /100 | #329 | Tragic 7.8% |
| Yakama | 0.0 /100 | #330 | Tragic 7.9% |
| Alaska Natives | 0.0 /100 | #331 | Tragic 8.1% |