Immigrants from Hong Kong vs Croatian Hearing Disability
COMPARE
Immigrants from Hong Kong
Croatian
Hearing Disability
Hearing Disability Comparison
Immigrants from Hong Kong
Croatians
2.7%
HEARING DISABILITY
99.2/ 100
METRIC RATING
51st/ 347
METRIC RANK
3.4%
HEARING DISABILITY
0.4/ 100
METRIC RATING
252nd/ 347
METRIC RANK
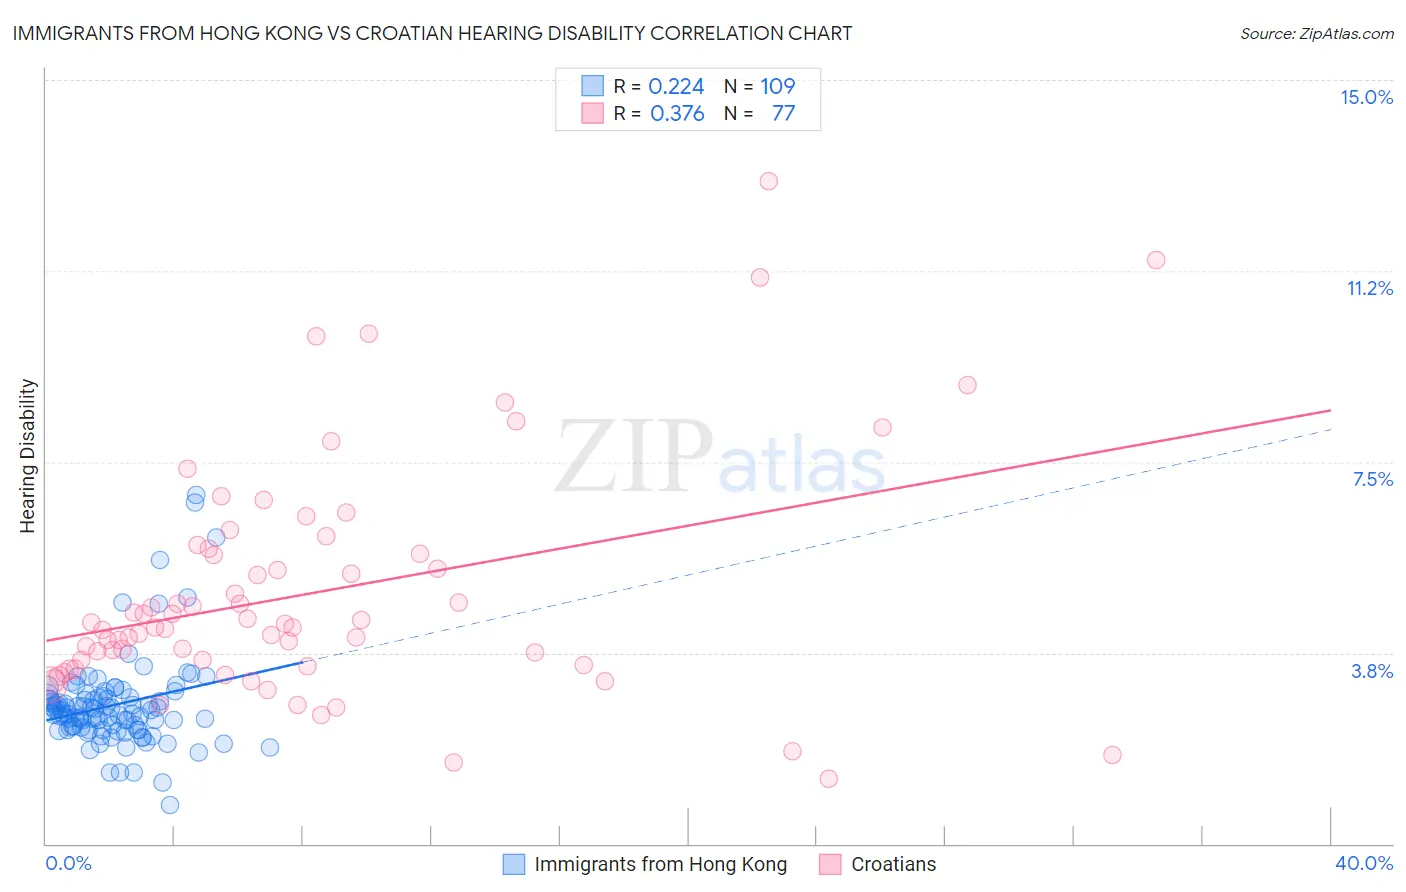
Immigrants from Hong Kong vs Croatian Hearing Disability Correlation Chart
The statistical analysis conducted on geographies consisting of 253,945,747 people shows a weak positive correlation between the proportion of Immigrants from Hong Kong and percentage of population with hearing disability in the United States with a correlation coefficient (R) of 0.224 and weighted average of 2.7%. Similarly, the statistical analysis conducted on geographies consisting of 375,644,002 people shows a mild positive correlation between the proportion of Croatians and percentage of population with hearing disability in the United States with a correlation coefficient (R) of 0.376 and weighted average of 3.4%, a difference of 27.5%.
Hearing Disability Correlation Summary
| Measurement | Immigrants from Hong Kong | Croatian |
| Minimum | 0.77% | 1.3% |
| Maximum | 6.9% | 13.0% |
| Range | 6.1% | 11.7% |
| Mean | 2.7% | 4.9% |
| Median | 2.6% | 4.3% |
| Interquartile 25% (IQ1) | 2.3% | 3.5% |
| Interquartile 75% (IQ3) | 2.9% | 5.8% |
| Interquartile Range (IQR) | 0.63% | 2.3% |
| Standard Deviation (Sample) | 0.93% | 2.3% |
| Standard Deviation (Population) | 0.92% | 2.3% |
Similar Demographics by Hearing Disability
Demographics Similar to Immigrants from Hong Kong by Hearing Disability
In terms of hearing disability, the demographic groups most similar to Immigrants from Hong Kong are Paraguayan (2.7%, a difference of 0.070%), Immigrants from South America (2.7%, a difference of 0.26%), Jamaican (2.7%, a difference of 0.36%), Immigrants from Singapore (2.6%, a difference of 0.38%), and Immigrants from Eastern Asia (2.7%, a difference of 0.42%).
| Demographics | Rating | Rank | Hearing Disability |
| Nigerians | 99.4 /100 | #44 | Exceptional 2.6% |
| Venezuelans | 99.4 /100 | #45 | Exceptional 2.6% |
| Immigrants | Dominica | 99.3 /100 | #46 | Exceptional 2.6% |
| Immigrants | Israel | 99.3 /100 | #47 | Exceptional 2.6% |
| Immigrants | Singapore | 99.3 /100 | #48 | Exceptional 2.6% |
| Immigrants | South America | 99.2 /100 | #49 | Exceptional 2.7% |
| Paraguayans | 99.2 /100 | #50 | Exceptional 2.7% |
| Immigrants | Hong Kong | 99.2 /100 | #51 | Exceptional 2.7% |
| Jamaicans | 99.0 /100 | #52 | Exceptional 2.7% |
| Immigrants | Eastern Asia | 99.0 /100 | #53 | Exceptional 2.7% |
| Ethiopians | 99.0 /100 | #54 | Exceptional 2.7% |
| Immigrants | Ethiopia | 99.0 /100 | #55 | Exceptional 2.7% |
| Immigrants | Nicaragua | 99.0 /100 | #56 | Exceptional 2.7% |
| South Americans | 99.0 /100 | #57 | Exceptional 2.7% |
| Immigrants | Peru | 98.6 /100 | #58 | Exceptional 2.7% |
Demographics Similar to Croatians by Hearing Disability
In terms of hearing disability, the demographic groups most similar to Croatians are Hungarian (3.4%, a difference of 0.21%), Yuman (3.4%, a difference of 0.44%), Italian (3.4%, a difference of 0.45%), Carpatho Rusyn (3.4%, a difference of 0.45%), and Slavic (3.4%, a difference of 0.87%).
| Demographics | Rating | Rank | Hearing Disability |
| Immigrants | Scotland | 0.8 /100 | #245 | Tragic 3.3% |
| Immigrants | England | 0.7 /100 | #246 | Tragic 3.3% |
| Lithuanians | 0.6 /100 | #247 | Tragic 3.4% |
| Austrians | 0.6 /100 | #248 | Tragic 3.4% |
| Italians | 0.4 /100 | #249 | Tragic 3.4% |
| Yuman | 0.4 /100 | #250 | Tragic 3.4% |
| Hungarians | 0.4 /100 | #251 | Tragic 3.4% |
| Croatians | 0.4 /100 | #252 | Tragic 3.4% |
| Carpatho Rusyns | 0.3 /100 | #253 | Tragic 3.4% |
| Slavs | 0.2 /100 | #254 | Tragic 3.4% |
| Poles | 0.2 /100 | #255 | Tragic 3.4% |
| Hmong | 0.2 /100 | #256 | Tragic 3.4% |
| Yaqui | 0.2 /100 | #257 | Tragic 3.4% |
| Northern Europeans | 0.2 /100 | #258 | Tragic 3.4% |
| Slovenes | 0.1 /100 | #259 | Tragic 3.5% |