Immigrants from Honduras vs Paiute 8th Grade
COMPARE
Immigrants from Honduras
Paiute
8th Grade
8th Grade Comparison
Immigrants from Honduras
Paiute
91.9%
8TH GRADE
0.0/ 100
METRIC RATING
336th/ 347
METRIC RANK
95.1%
8TH GRADE
1.7/ 100
METRIC RATING
243rd/ 347
METRIC RANK
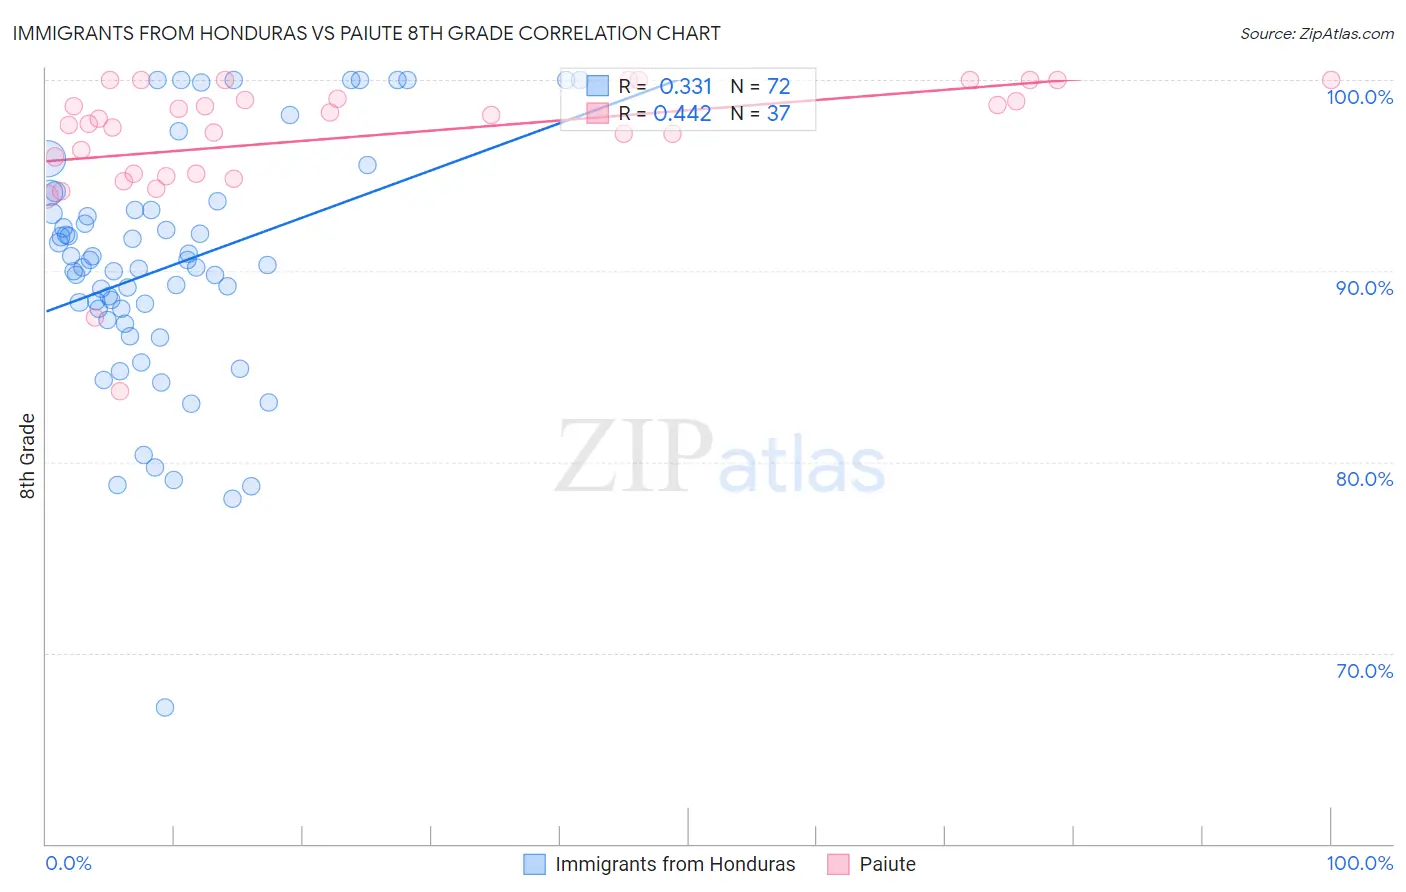
Immigrants from Honduras vs Paiute 8th Grade Correlation Chart
The statistical analysis conducted on geographies consisting of 322,637,445 people shows a mild positive correlation between the proportion of Immigrants from Honduras and percentage of population with at least 8th grade education in the United States with a correlation coefficient (R) of 0.331 and weighted average of 91.9%. Similarly, the statistical analysis conducted on geographies consisting of 58,403,520 people shows a moderate positive correlation between the proportion of Paiute and percentage of population with at least 8th grade education in the United States with a correlation coefficient (R) of 0.442 and weighted average of 95.1%, a difference of 3.5%.
8th Grade Correlation Summary
| Measurement | Immigrants from Honduras | Paiute |
| Minimum | 67.1% | 83.7% |
| Maximum | 100.0% | 100.0% |
| Range | 32.9% | 16.3% |
| Mean | 90.2% | 97.1% |
| Median | 90.2% | 97.9% |
| Interquartile 25% (IQ1) | 87.7% | 95.1% |
| Interquartile 75% (IQ3) | 93.2% | 99.5% |
| Interquartile Range (IQR) | 5.5% | 4.4% |
| Standard Deviation (Sample) | 6.3% | 3.4% |
| Standard Deviation (Population) | 6.3% | 3.4% |
Similar Demographics by 8th Grade
Demographics Similar to Immigrants from Honduras by 8th Grade
In terms of 8th grade, the demographic groups most similar to Immigrants from Honduras are Mexican American Indian (92.1%, a difference of 0.19%), Immigrants from Latin America (91.7%, a difference of 0.23%), Immigrants from Yemen (92.1%, a difference of 0.24%), Hispanic or Latino (92.2%, a difference of 0.30%), and Central American (91.6%, a difference of 0.37%).
| Demographics | Rating | Rank | 8th Grade |
| Immigrants | Cabo Verde | 0.0 /100 | #329 | Tragic 92.4% |
| Immigrants | Armenia | 0.0 /100 | #330 | Tragic 92.3% |
| Hondurans | 0.0 /100 | #331 | Tragic 92.3% |
| Immigrants | Dominican Republic | 0.0 /100 | #332 | Tragic 92.3% |
| Hispanics or Latinos | 0.0 /100 | #333 | Tragic 92.2% |
| Immigrants | Yemen | 0.0 /100 | #334 | Tragic 92.1% |
| Mexican American Indians | 0.0 /100 | #335 | Tragic 92.1% |
| Immigrants | Honduras | 0.0 /100 | #336 | Tragic 91.9% |
| Immigrants | Latin America | 0.0 /100 | #337 | Tragic 91.7% |
| Central Americans | 0.0 /100 | #338 | Tragic 91.6% |
| Mexicans | 0.0 /100 | #339 | Tragic 91.4% |
| Yakama | 0.0 /100 | #340 | Tragic 91.2% |
| Guatemalans | 0.0 /100 | #341 | Tragic 91.1% |
| Salvadorans | 0.0 /100 | #342 | Tragic 90.9% |
| Immigrants | Guatemala | 0.0 /100 | #343 | Tragic 90.7% |
Demographics Similar to Paiute by 8th Grade
In terms of 8th grade, the demographic groups most similar to Paiute are Tongan (95.1%, a difference of 0.0%), Immigrants from Middle Africa (95.1%, a difference of 0.0%), South American Indian (95.1%, a difference of 0.020%), Immigrants from Sierra Leone (95.1%, a difference of 0.030%), and Ethiopian (95.1%, a difference of 0.030%).
| Demographics | Rating | Rank | 8th Grade |
| Senegalese | 2.7 /100 | #236 | Tragic 95.2% |
| Immigrants | Africa | 2.7 /100 | #237 | Tragic 95.2% |
| Natives/Alaskans | 2.3 /100 | #238 | Tragic 95.2% |
| Immigrants | Sierra Leone | 2.1 /100 | #239 | Tragic 95.1% |
| Ethiopians | 2.0 /100 | #240 | Tragic 95.1% |
| South American Indians | 1.9 /100 | #241 | Tragic 95.1% |
| Tongans | 1.7 /100 | #242 | Tragic 95.1% |
| Paiute | 1.7 /100 | #243 | Tragic 95.1% |
| Immigrants | Middle Africa | 1.7 /100 | #244 | Tragic 95.1% |
| Jamaicans | 1.4 /100 | #245 | Tragic 95.1% |
| Somalis | 1.4 /100 | #246 | Tragic 95.1% |
| Immigrants | Senegal | 1.4 /100 | #247 | Tragic 95.1% |
| Uruguayans | 1.2 /100 | #248 | Tragic 95.1% |
| Immigrants | China | 1.1 /100 | #249 | Tragic 95.0% |
| Koreans | 1.1 /100 | #250 | Tragic 95.0% |