Immigrants from Honduras vs Yugoslavian Vision Disability
COMPARE
Immigrants from Honduras
Yugoslavian
Vision Disability
Vision Disability Comparison
Immigrants from Honduras
Yugoslavians
2.5%
VISION DISABILITY
0.0/ 100
METRIC RATING
291st/ 347
METRIC RANK
2.2%
VISION DISABILITY
46.5/ 100
METRIC RATING
176th/ 347
METRIC RANK
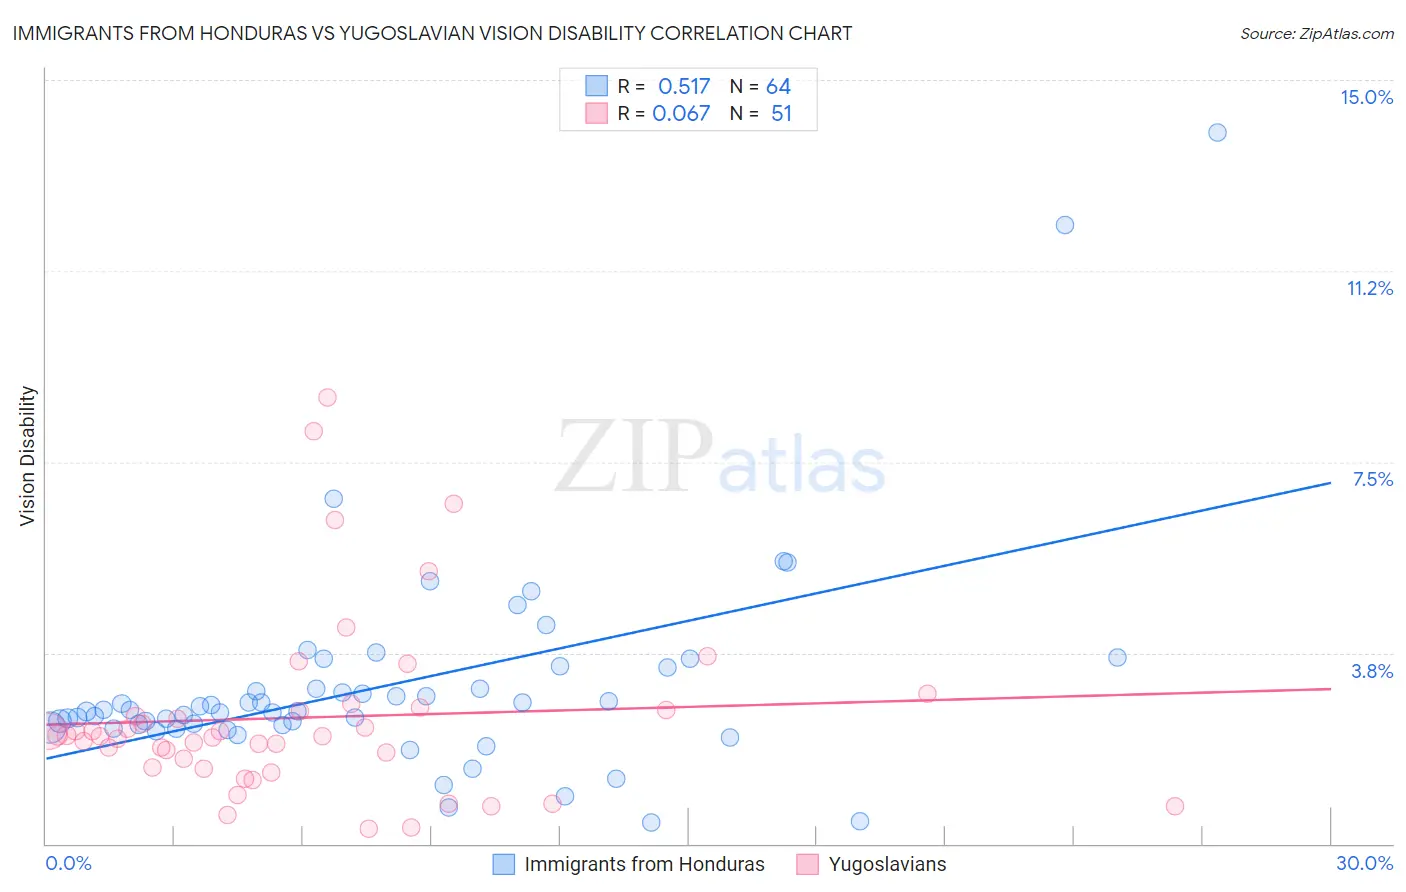
Immigrants from Honduras vs Yugoslavian Vision Disability Correlation Chart
The statistical analysis conducted on geographies consisting of 322,475,782 people shows a substantial positive correlation between the proportion of Immigrants from Honduras and percentage of population with vision disability in the United States with a correlation coefficient (R) of 0.517 and weighted average of 2.5%. Similarly, the statistical analysis conducted on geographies consisting of 285,572,549 people shows a slight positive correlation between the proportion of Yugoslavians and percentage of population with vision disability in the United States with a correlation coefficient (R) of 0.067 and weighted average of 2.2%, a difference of 14.8%.
Vision Disability Correlation Summary
| Measurement | Immigrants from Honduras | Yugoslavian |
| Minimum | 0.42% | 0.30% |
| Maximum | 14.0% | 8.8% |
| Range | 13.5% | 8.5% |
| Mean | 3.1% | 2.5% |
| Median | 2.6% | 2.1% |
| Interquartile 25% (IQ1) | 2.3% | 1.5% |
| Interquartile 75% (IQ3) | 3.3% | 2.6% |
| Interquartile Range (IQR) | 0.94% | 1.1% |
| Standard Deviation (Sample) | 2.1% | 1.8% |
| Standard Deviation (Population) | 2.1% | 1.8% |
Similar Demographics by Vision Disability
Demographics Similar to Immigrants from Honduras by Vision Disability
In terms of vision disability, the demographic groups most similar to Immigrants from Honduras are Crow (2.5%, a difference of 0.10%), Yaqui (2.5%, a difference of 0.12%), Immigrants from Cuba (2.5%, a difference of 0.39%), Ottawa (2.5%, a difference of 0.46%), and Nonimmigrants (2.5%, a difference of 0.53%).
| Demographics | Rating | Rank | Vision Disability |
| Yakama | 0.0 /100 | #284 | Tragic 2.5% |
| Immigrants | Central America | 0.0 /100 | #285 | Tragic 2.5% |
| Sioux | 0.0 /100 | #286 | Tragic 2.5% |
| Hondurans | 0.0 /100 | #287 | Tragic 2.5% |
| French American Indians | 0.0 /100 | #288 | Tragic 2.5% |
| Immigrants | Nonimmigrants | 0.0 /100 | #289 | Tragic 2.5% |
| Immigrants | Cuba | 0.0 /100 | #290 | Tragic 2.5% |
| Immigrants | Honduras | 0.0 /100 | #291 | Tragic 2.5% |
| Crow | 0.0 /100 | #292 | Tragic 2.5% |
| Yaqui | 0.0 /100 | #293 | Tragic 2.5% |
| Ottawa | 0.0 /100 | #294 | Tragic 2.5% |
| Delaware | 0.0 /100 | #295 | Tragic 2.5% |
| Immigrants | Mexico | 0.0 /100 | #296 | Tragic 2.5% |
| Immigrants | Dominica | 0.0 /100 | #297 | Tragic 2.5% |
| Mexicans | 0.0 /100 | #298 | Tragic 2.5% |
Demographics Similar to Yugoslavians by Vision Disability
In terms of vision disability, the demographic groups most similar to Yugoslavians are Slavic (2.2%, a difference of 0.040%), Immigrants from Fiji (2.2%, a difference of 0.070%), Immigrants from Oceania (2.2%, a difference of 0.090%), Immigrants from North America (2.2%, a difference of 0.13%), and Northern European (2.2%, a difference of 0.22%).
| Demographics | Rating | Rank | Vision Disability |
| South American Indians | 57.4 /100 | #169 | Average 2.2% |
| Swiss | 55.7 /100 | #170 | Average 2.2% |
| Lebanese | 54.3 /100 | #171 | Average 2.2% |
| Northern Europeans | 50.1 /100 | #172 | Average 2.2% |
| Scandinavians | 50.0 /100 | #173 | Average 2.2% |
| Immigrants | Canada | 50.0 /100 | #174 | Average 2.2% |
| Immigrants | Fiji | 47.6 /100 | #175 | Average 2.2% |
| Yugoslavians | 46.5 /100 | #176 | Average 2.2% |
| Slavs | 46.0 /100 | #177 | Average 2.2% |
| Immigrants | Oceania | 45.1 /100 | #178 | Average 2.2% |
| Immigrants | North America | 44.5 /100 | #179 | Average 2.2% |
| Uruguayans | 42.7 /100 | #180 | Average 2.2% |
| Immigrants | Western Europe | 41.1 /100 | #181 | Average 2.2% |
| Costa Ricans | 40.7 /100 | #182 | Average 2.2% |
| Immigrants | Burma/Myanmar | 37.9 /100 | #183 | Fair 2.2% |