Immigrants from Cambodia vs Syrian Male Disability
COMPARE
Immigrants from Cambodia
Syrian
Male Disability
Male Disability Comparison
Immigrants from Cambodia
Syrians
11.5%
MALE DISABILITY
10.8/ 100
METRIC RATING
204th/ 347
METRIC RANK
11.2%
MALE DISABILITY
46.6/ 100
METRIC RATING
176th/ 347
METRIC RANK
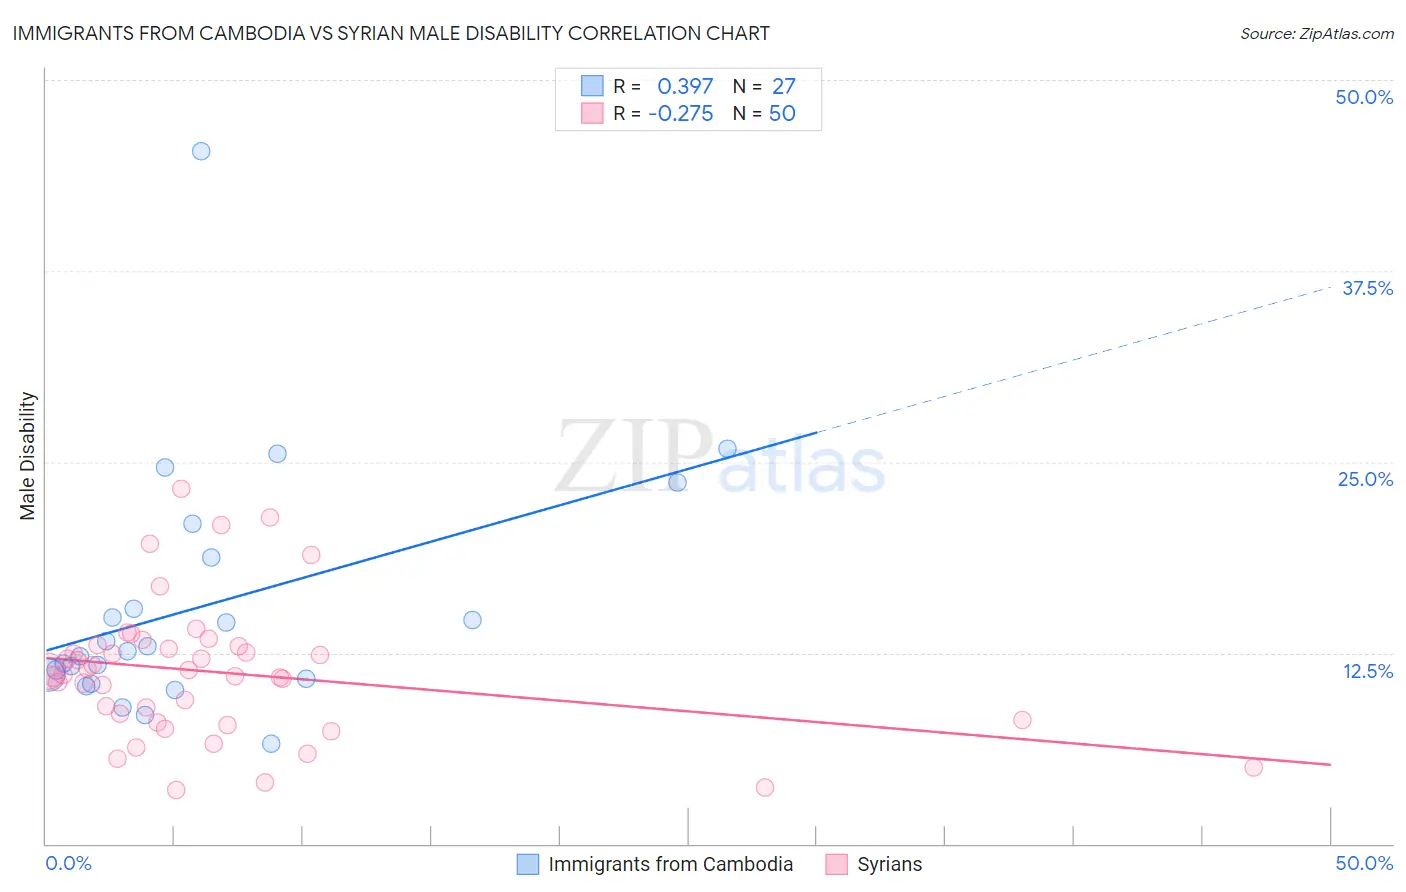
Immigrants from Cambodia vs Syrian Male Disability Correlation Chart
The statistical analysis conducted on geographies consisting of 205,155,985 people shows a mild positive correlation between the proportion of Immigrants from Cambodia and percentage of males with a disability in the United States with a correlation coefficient (R) of 0.397 and weighted average of 11.5%. Similarly, the statistical analysis conducted on geographies consisting of 266,314,155 people shows a weak negative correlation between the proportion of Syrians and percentage of males with a disability in the United States with a correlation coefficient (R) of -0.275 and weighted average of 11.2%, a difference of 2.7%.
Male Disability Correlation Summary
| Measurement | Immigrants from Cambodia | Syrian |
| Minimum | 6.5% | 3.5% |
| Maximum | 45.3% | 23.2% |
| Range | 38.8% | 19.7% |
| Mean | 15.5% | 11.2% |
| Median | 12.6% | 11.2% |
| Interquartile 25% (IQ1) | 10.8% | 8.1% |
| Interquartile 75% (IQ3) | 18.7% | 12.9% |
| Interquartile Range (IQR) | 7.9% | 4.8% |
| Standard Deviation (Sample) | 8.0% | 4.4% |
| Standard Deviation (Population) | 7.9% | 4.4% |
Similar Demographics by Male Disability
Demographics Similar to Immigrants from Cambodia by Male Disability
In terms of male disability, the demographic groups most similar to Immigrants from Cambodia are Serbian (11.5%, a difference of 0.0%), Jamaican (11.5%, a difference of 0.010%), Ukrainian (11.5%, a difference of 0.010%), Immigrants from Somalia (11.5%, a difference of 0.050%), and Icelander (11.6%, a difference of 0.090%).
| Demographics | Rating | Rank | Male Disability |
| Somalis | 18.2 /100 | #197 | Poor 11.4% |
| Immigrants | Jamaica | 16.3 /100 | #198 | Poor 11.5% |
| Lebanese | 15.4 /100 | #199 | Poor 11.5% |
| Immigrants | Iraq | 13.0 /100 | #200 | Poor 11.5% |
| Immigrants | Panama | 13.0 /100 | #201 | Poor 11.5% |
| Immigrants | Mexico | 12.6 /100 | #202 | Poor 11.5% |
| Jamaicans | 10.9 /100 | #203 | Poor 11.5% |
| Immigrants | Cambodia | 10.8 /100 | #204 | Poor 11.5% |
| Serbians | 10.7 /100 | #205 | Poor 11.5% |
| Ukrainians | 10.6 /100 | #206 | Poor 11.5% |
| Immigrants | Somalia | 10.4 /100 | #207 | Poor 11.5% |
| Icelanders | 10.1 /100 | #208 | Poor 11.6% |
| Spanish American Indians | 10.1 /100 | #209 | Poor 11.6% |
| Ute | 9.4 /100 | #210 | Tragic 11.6% |
| Immigrants | Thailand | 8.4 /100 | #211 | Tragic 11.6% |
Demographics Similar to Syrians by Male Disability
In terms of male disability, the demographic groups most similar to Syrians are Immigrants from Honduras (11.2%, a difference of 0.12%), Immigrants from Norway (11.3%, a difference of 0.13%), Maltese (11.2%, a difference of 0.19%), Immigrants from Burma/Myanmar (11.2%, a difference of 0.21%), and Romanian (11.2%, a difference of 0.23%).
| Demographics | Rating | Rank | Male Disability |
| Barbadians | 53.4 /100 | #169 | Average 11.2% |
| New Zealanders | 52.9 /100 | #170 | Average 11.2% |
| Haitians | 52.5 /100 | #171 | Average 11.2% |
| Romanians | 50.7 /100 | #172 | Average 11.2% |
| Immigrants | Burma/Myanmar | 50.4 /100 | #173 | Average 11.2% |
| Maltese | 50.0 /100 | #174 | Average 11.2% |
| Immigrants | Honduras | 48.7 /100 | #175 | Average 11.2% |
| Syrians | 46.6 /100 | #176 | Average 11.2% |
| Immigrants | Norway | 44.2 /100 | #177 | Average 11.3% |
| Australians | 42.2 /100 | #178 | Average 11.3% |
| Immigrants | Caribbean | 41.4 /100 | #179 | Average 11.3% |
| Hondurans | 41.1 /100 | #180 | Average 11.3% |
| Immigrants | Senegal | 34.4 /100 | #181 | Fair 11.3% |
| Immigrants | Belize | 33.7 /100 | #182 | Fair 11.3% |
| Immigrants | Central America | 32.9 /100 | #183 | Fair 11.3% |