Immigrants from Dominica vs Shoshone Male Disability
COMPARE
Immigrants from Dominica
Shoshone
Male Disability
Male Disability Comparison
Immigrants from Dominica
Shoshone
11.7%
MALE DISABILITY
4.6/ 100
METRIC RATING
217th/ 347
METRIC RANK
13.8%
MALE DISABILITY
0.0/ 100
METRIC RATING
321st/ 347
METRIC RANK
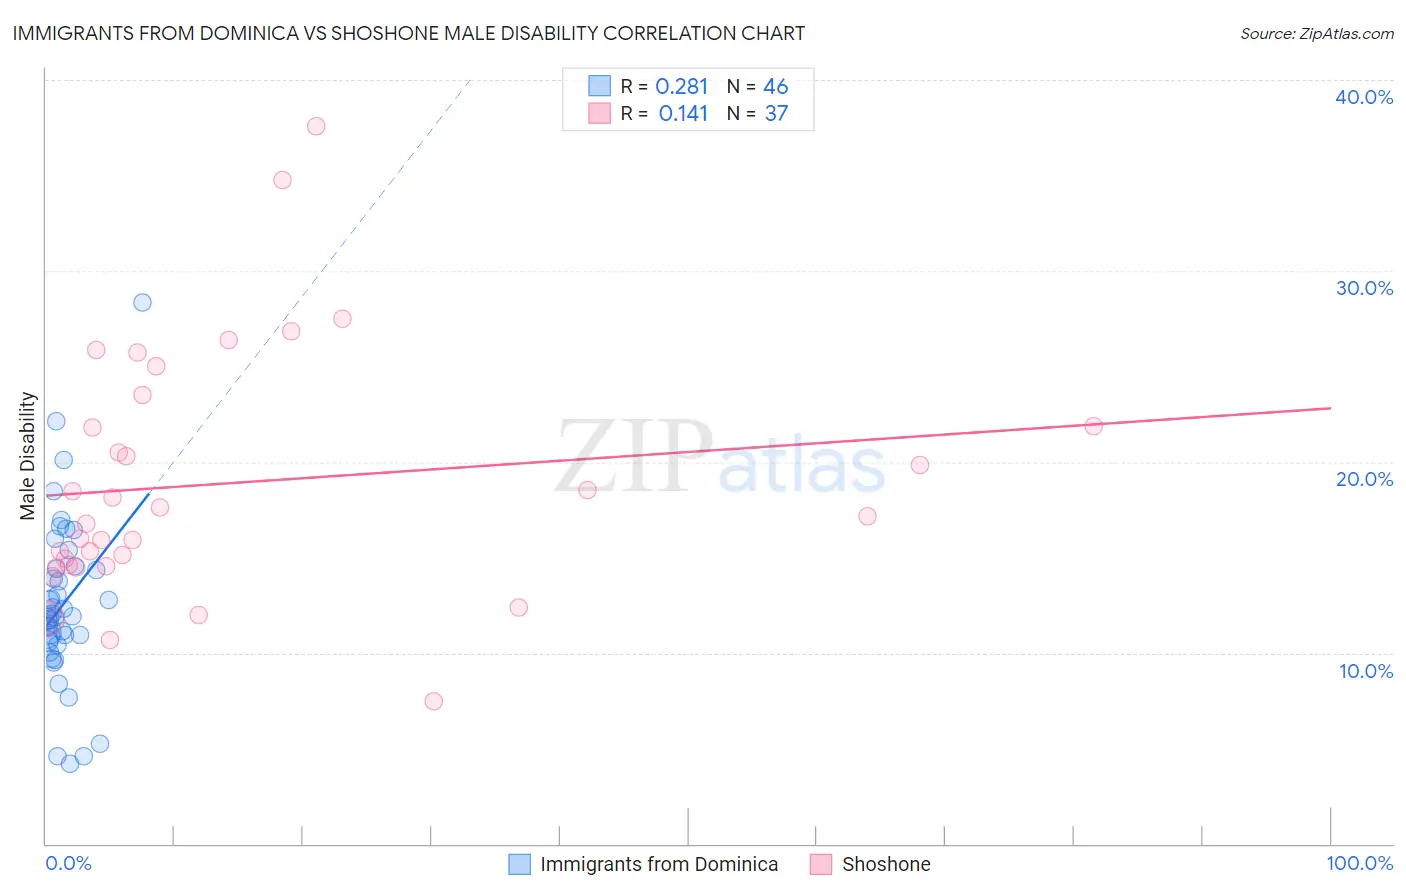
Immigrants from Dominica vs Shoshone Male Disability Correlation Chart
The statistical analysis conducted on geographies consisting of 83,789,752 people shows a weak positive correlation between the proportion of Immigrants from Dominica and percentage of males with a disability in the United States with a correlation coefficient (R) of 0.281 and weighted average of 11.7%. Similarly, the statistical analysis conducted on geographies consisting of 66,619,814 people shows a poor positive correlation between the proportion of Shoshone and percentage of males with a disability in the United States with a correlation coefficient (R) of 0.141 and weighted average of 13.8%, a difference of 18.5%.
Male Disability Correlation Summary
| Measurement | Immigrants from Dominica | Shoshone |
| Minimum | 4.2% | 7.4% |
| Maximum | 28.4% | 37.6% |
| Range | 24.2% | 30.1% |
| Mean | 12.5% | 18.9% |
| Median | 11.9% | 17.1% |
| Interquartile 25% (IQ1) | 10.6% | 14.6% |
| Interquartile 75% (IQ3) | 14.4% | 22.7% |
| Interquartile Range (IQR) | 3.8% | 8.1% |
| Standard Deviation (Sample) | 4.4% | 6.5% |
| Standard Deviation (Population) | 4.4% | 6.4% |
Similar Demographics by Male Disability
Demographics Similar to Immigrants from Dominica by Male Disability
In terms of male disability, the demographic groups most similar to Immigrants from Dominica are Immigrants from Dominican Republic (11.7%, a difference of 0.070%), Immigrants from England (11.7%, a difference of 0.21%), Panamanian (11.7%, a difference of 0.27%), Immigrants from Western Europe (11.7%, a difference of 0.28%), and Immigrants from Congo (11.7%, a difference of 0.29%).
| Demographics | Rating | Rank | Male Disability |
| Ute | 9.4 /100 | #210 | Tragic 11.6% |
| Immigrants | Thailand | 8.4 /100 | #211 | Tragic 11.6% |
| Immigrants | Scotland | 8.2 /100 | #212 | Tragic 11.6% |
| Mexican American Indians | 7.8 /100 | #213 | Tragic 11.6% |
| Lithuanians | 6.6 /100 | #214 | Tragic 11.6% |
| Indonesians | 5.9 /100 | #215 | Tragic 11.6% |
| Immigrants | Dominican Republic | 4.9 /100 | #216 | Tragic 11.7% |
| Immigrants | Dominica | 4.6 /100 | #217 | Tragic 11.7% |
| Immigrants | England | 4.0 /100 | #218 | Tragic 11.7% |
| Panamanians | 3.8 /100 | #219 | Tragic 11.7% |
| Immigrants | Western Europe | 3.8 /100 | #220 | Tragic 11.7% |
| Immigrants | Congo | 3.7 /100 | #221 | Tragic 11.7% |
| Alsatians | 3.3 /100 | #222 | Tragic 11.7% |
| Immigrants | Bahamas | 3.2 /100 | #223 | Tragic 11.7% |
| Japanese | 3.1 /100 | #224 | Tragic 11.7% |
Demographics Similar to Shoshone by Male Disability
In terms of male disability, the demographic groups most similar to Shoshone are Tlingit-Haida (13.8%, a difference of 0.050%), American (13.8%, a difference of 0.54%), Cree (13.7%, a difference of 0.96%), Apache (14.0%, a difference of 1.1%), and Paiute (13.7%, a difference of 1.2%).
| Demographics | Rating | Rank | Male Disability |
| Aleuts | 0.0 /100 | #314 | Tragic 13.5% |
| Iroquois | 0.0 /100 | #315 | Tragic 13.6% |
| Alaska Natives | 0.0 /100 | #316 | Tragic 13.6% |
| Paiute | 0.0 /100 | #317 | Tragic 13.7% |
| Cree | 0.0 /100 | #318 | Tragic 13.7% |
| Americans | 0.0 /100 | #319 | Tragic 13.8% |
| Tlingit-Haida | 0.0 /100 | #320 | Tragic 13.8% |
| Shoshone | 0.0 /100 | #321 | Tragic 13.8% |
| Apache | 0.0 /100 | #322 | Tragic 14.0% |
| Osage | 0.0 /100 | #323 | Tragic 14.0% |
| Comanche | 0.0 /100 | #324 | Tragic 14.1% |
| Ottawa | 0.0 /100 | #325 | Tragic 14.1% |
| Natives/Alaskans | 0.0 /100 | #326 | Tragic 14.2% |
| Potawatomi | 0.0 /100 | #327 | Tragic 14.2% |
| Chippewa | 0.0 /100 | #328 | Tragic 14.3% |