Immigrants from Haiti vs Central American Receiving Food Stamps
COMPARE
Immigrants from Haiti
Central American
Receiving Food Stamps
Receiving Food Stamps Comparison
Immigrants from Haiti
Central Americans
18.2%
RECEIVING FOOD STAMPS
0.0/ 100
METRIC RATING
325th/ 347
METRIC RANK
14.1%
RECEIVING FOOD STAMPS
0.3/ 100
METRIC RATING
260th/ 347
METRIC RANK
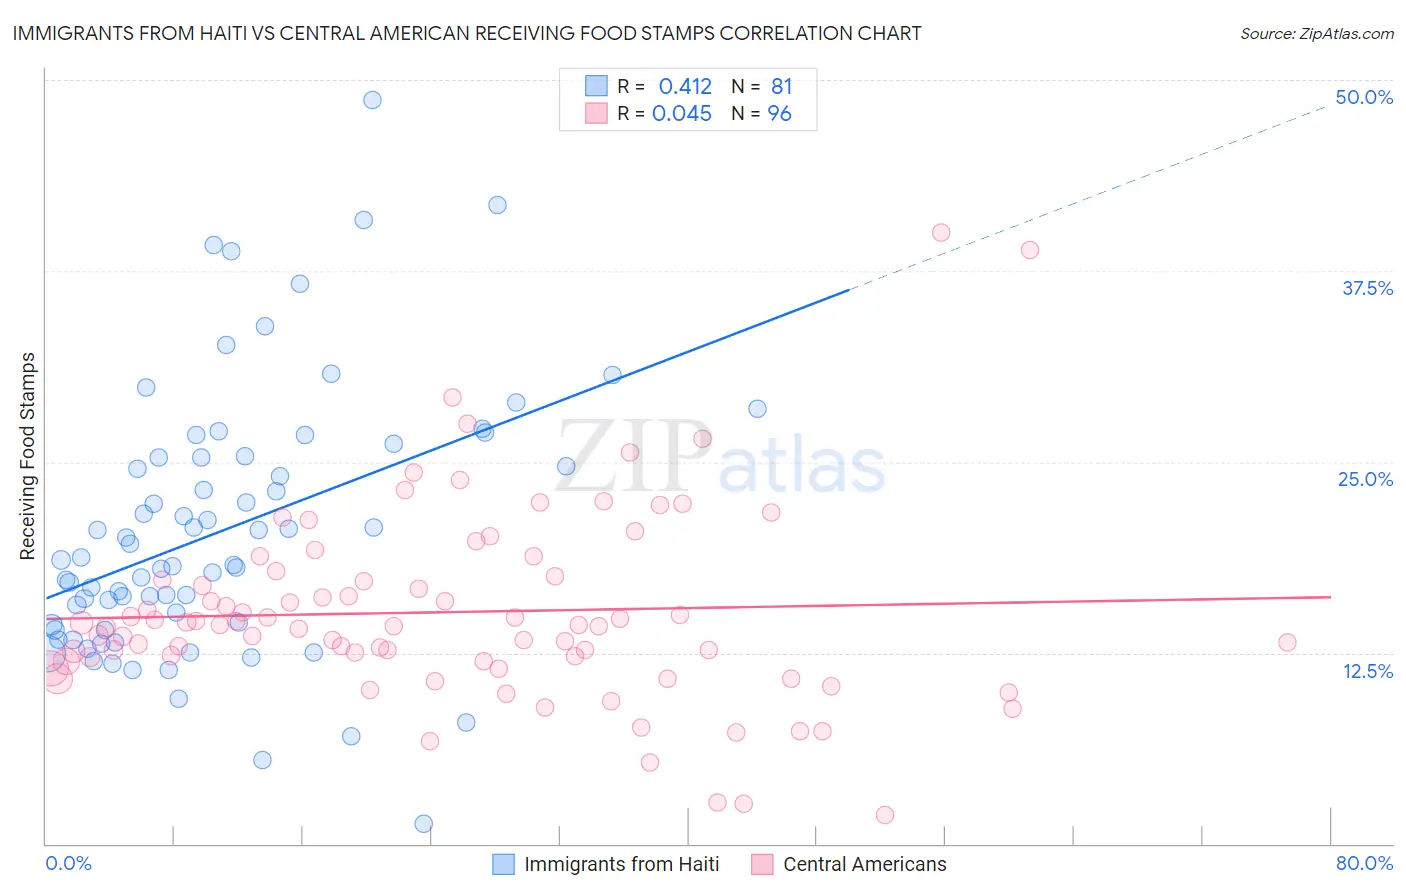
Immigrants from Haiti vs Central American Receiving Food Stamps Correlation Chart
The statistical analysis conducted on geographies consisting of 225,016,016 people shows a moderate positive correlation between the proportion of Immigrants from Haiti and percentage of population receiving government assistance and/or food stamps in the United States with a correlation coefficient (R) of 0.412 and weighted average of 18.2%. Similarly, the statistical analysis conducted on geographies consisting of 502,597,992 people shows no correlation between the proportion of Central Americans and percentage of population receiving government assistance and/or food stamps in the United States with a correlation coefficient (R) of 0.045 and weighted average of 14.1%, a difference of 28.7%.
Receiving Food Stamps Correlation Summary
| Measurement | Immigrants from Haiti | Central American |
| Minimum | 1.3% | 1.9% |
| Maximum | 48.7% | 40.0% |
| Range | 47.4% | 38.1% |
| Mean | 20.5% | 15.2% |
| Median | 18.6% | 14.3% |
| Interquartile 25% (IQ1) | 14.2% | 12.1% |
| Interquartile 75% (IQ3) | 25.4% | 17.4% |
| Interquartile Range (IQR) | 11.2% | 5.3% |
| Standard Deviation (Sample) | 8.7% | 6.3% |
| Standard Deviation (Population) | 8.7% | 6.3% |
Similar Demographics by Receiving Food Stamps
Demographics Similar to Immigrants from Haiti by Receiving Food Stamps
In terms of receiving food stamps, the demographic groups most similar to Immigrants from Haiti are Cuban (18.2%, a difference of 0.11%), Apache (18.3%, a difference of 0.42%), Colville (18.3%, a difference of 0.63%), Immigrants from Dominica (18.4%, a difference of 1.1%), and British West Indian (17.9%, a difference of 1.8%).
| Demographics | Rating | Rank | Receiving Food Stamps |
| Menominee | 0.0 /100 | #318 | Tragic 17.2% |
| Immigrants | St. Vincent and the Grenadines | 0.0 /100 | #319 | Tragic 17.2% |
| Immigrants | Nicaragua | 0.0 /100 | #320 | Tragic 17.2% |
| Natives/Alaskans | 0.0 /100 | #321 | Tragic 17.3% |
| Immigrants | Grenada | 0.0 /100 | #322 | Tragic 17.8% |
| Haitians | 0.0 /100 | #323 | Tragic 17.8% |
| British West Indians | 0.0 /100 | #324 | Tragic 17.9% |
| Immigrants | Haiti | 0.0 /100 | #325 | Tragic 18.2% |
| Cubans | 0.0 /100 | #326 | Tragic 18.2% |
| Apache | 0.0 /100 | #327 | Tragic 18.3% |
| Colville | 0.0 /100 | #328 | Tragic 18.3% |
| Immigrants | Dominica | 0.0 /100 | #329 | Tragic 18.4% |
| Pima | 0.0 /100 | #330 | Tragic 19.0% |
| Immigrants | Caribbean | 0.0 /100 | #331 | Tragic 19.6% |
| Pueblo | 0.0 /100 | #332 | Tragic 19.9% |
Demographics Similar to Central Americans by Receiving Food Stamps
In terms of receiving food stamps, the demographic groups most similar to Central Americans are Immigrants from Congo (14.1%, a difference of 0.010%), Creek (14.1%, a difference of 0.090%), Immigrants from Ghana (14.1%, a difference of 0.22%), Arapaho (14.1%, a difference of 0.30%), and Japanese (14.1%, a difference of 0.40%).
| Demographics | Rating | Rank | Receiving Food Stamps |
| Spanish Americans | 0.4 /100 | #253 | Tragic 14.0% |
| Marshallese | 0.3 /100 | #254 | Tragic 14.1% |
| Sub-Saharan Africans | 0.3 /100 | #255 | Tragic 14.1% |
| Japanese | 0.3 /100 | #256 | Tragic 14.1% |
| Arapaho | 0.3 /100 | #257 | Tragic 14.1% |
| Immigrants | Ghana | 0.3 /100 | #258 | Tragic 14.1% |
| Creek | 0.3 /100 | #259 | Tragic 14.1% |
| Central Americans | 0.3 /100 | #260 | Tragic 14.1% |
| Immigrants | Congo | 0.3 /100 | #261 | Tragic 14.1% |
| Paiute | 0.2 /100 | #262 | Tragic 14.3% |
| Immigrants | Portugal | 0.2 /100 | #263 | Tragic 14.3% |
| Immigrants | Uzbekistan | 0.2 /100 | #264 | Tragic 14.3% |
| Blackfeet | 0.2 /100 | #265 | Tragic 14.3% |
| Cheyenne | 0.2 /100 | #266 | Tragic 14.3% |
| Dutch West Indians | 0.2 /100 | #267 | Tragic 14.3% |