Tongan vs Menominee Self-Care Disability
COMPARE
Tongan
Menominee
Self-Care Disability
Self-Care Disability Comparison
Tongans
Menominee
2.2%
SELF-CARE DISABILITY
100.0/ 100
METRIC RATING
20th/ 347
METRIC RANK
2.8%
SELF-CARE DISABILITY
0.0/ 100
METRIC RATING
316th/ 347
METRIC RANK
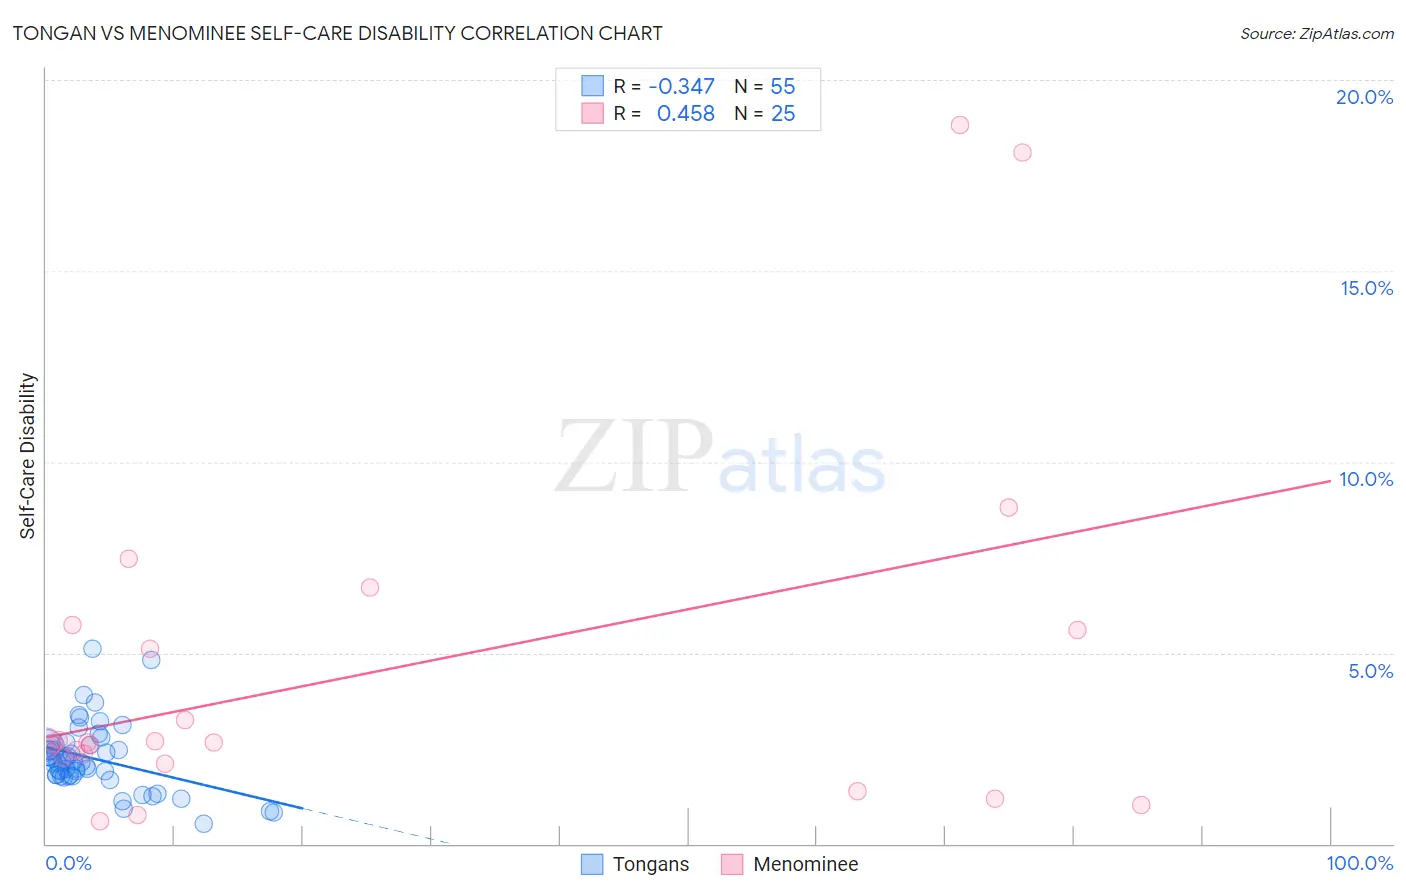
Tongan vs Menominee Self-Care Disability Correlation Chart
The statistical analysis conducted on geographies consisting of 102,855,608 people shows a mild negative correlation between the proportion of Tongans and percentage of population with self-care disability in the United States with a correlation coefficient (R) of -0.347 and weighted average of 2.2%. Similarly, the statistical analysis conducted on geographies consisting of 45,776,619 people shows a moderate positive correlation between the proportion of Menominee and percentage of population with self-care disability in the United States with a correlation coefficient (R) of 0.458 and weighted average of 2.8%, a difference of 28.0%.
Self-Care Disability Correlation Summary
| Measurement | Tongan | Menominee |
| Minimum | 0.51% | 0.59% |
| Maximum | 5.1% | 18.8% |
| Range | 4.6% | 18.2% |
| Mean | 2.2% | 4.5% |
| Median | 2.1% | 2.6% |
| Interquartile 25% (IQ1) | 1.8% | 2.2% |
| Interquartile 75% (IQ3) | 2.6% | 5.7% |
| Interquartile Range (IQR) | 0.81% | 3.5% |
| Standard Deviation (Sample) | 0.89% | 4.7% |
| Standard Deviation (Population) | 0.88% | 4.6% |
Similar Demographics by Self-Care Disability
Demographics Similar to Tongans by Self-Care Disability
In terms of self-care disability, the demographic groups most similar to Tongans are Immigrants from Eritrea (2.2%, a difference of 0.080%), Bulgarian (2.2%, a difference of 0.25%), Immigrants from Venezuela (2.2%, a difference of 0.29%), Immigrants from Taiwan (2.2%, a difference of 0.41%), and Cambodian (2.2%, a difference of 0.50%).
| Demographics | Rating | Rank | Self-Care Disability |
| Ethiopians | 100.0 /100 | #13 | Exceptional 2.2% |
| Luxembourgers | 100.0 /100 | #14 | Exceptional 2.2% |
| Okinawans | 100.0 /100 | #15 | Exceptional 2.2% |
| Immigrants | Kuwait | 100.0 /100 | #16 | Exceptional 2.2% |
| Immigrants | Saudi Arabia | 100.0 /100 | #17 | Exceptional 2.2% |
| Immigrants | Taiwan | 100.0 /100 | #18 | Exceptional 2.2% |
| Immigrants | Eritrea | 100.0 /100 | #19 | Exceptional 2.2% |
| Tongans | 100.0 /100 | #20 | Exceptional 2.2% |
| Bulgarians | 100.0 /100 | #21 | Exceptional 2.2% |
| Immigrants | Venezuela | 100.0 /100 | #22 | Exceptional 2.2% |
| Cambodians | 100.0 /100 | #23 | Exceptional 2.2% |
| Cypriots | 100.0 /100 | #24 | Exceptional 2.2% |
| Turks | 100.0 /100 | #25 | Exceptional 2.2% |
| Immigrants | Sri Lanka | 99.9 /100 | #26 | Exceptional 2.2% |
| Venezuelans | 99.9 /100 | #27 | Exceptional 2.2% |
Demographics Similar to Menominee by Self-Care Disability
In terms of self-care disability, the demographic groups most similar to Menominee are Immigrants from Cuba (2.8%, a difference of 0.10%), Immigrants from Dominica (2.8%, a difference of 0.13%), Assyrian/Chaldean/Syriac (2.8%, a difference of 0.14%), Spanish American Indian (2.9%, a difference of 0.29%), and Creek (2.8%, a difference of 0.32%).
| Demographics | Rating | Rank | Self-Care Disability |
| Bangladeshis | 0.0 /100 | #309 | Tragic 2.8% |
| British West Indians | 0.0 /100 | #310 | Tragic 2.8% |
| Puget Sound Salish | 0.0 /100 | #311 | Tragic 2.8% |
| Immigrants | Caribbean | 0.0 /100 | #312 | Tragic 2.8% |
| Spanish Americans | 0.0 /100 | #313 | Tragic 2.8% |
| Creek | 0.0 /100 | #314 | Tragic 2.8% |
| Immigrants | Cuba | 0.0 /100 | #315 | Tragic 2.8% |
| Menominee | 0.0 /100 | #316 | Tragic 2.8% |
| Immigrants | Dominica | 0.0 /100 | #317 | Tragic 2.8% |
| Assyrians/Chaldeans/Syriacs | 0.0 /100 | #318 | Tragic 2.8% |
| Spanish American Indians | 0.0 /100 | #319 | Tragic 2.9% |
| Chickasaw | 0.0 /100 | #320 | Tragic 2.9% |
| Navajo | 0.0 /100 | #321 | Tragic 2.9% |
| Comanche | 0.0 /100 | #322 | Tragic 2.9% |
| Seminole | 0.0 /100 | #323 | Tragic 2.9% |