Senegalese vs Menominee Self-Care Disability
COMPARE
Senegalese
Menominee
Self-Care Disability
Self-Care Disability Comparison
Senegalese
Menominee
2.6%
SELF-CARE DISABILITY
1.3/ 100
METRIC RATING
238th/ 347
METRIC RANK
2.8%
SELF-CARE DISABILITY
0.0/ 100
METRIC RATING
316th/ 347
METRIC RANK
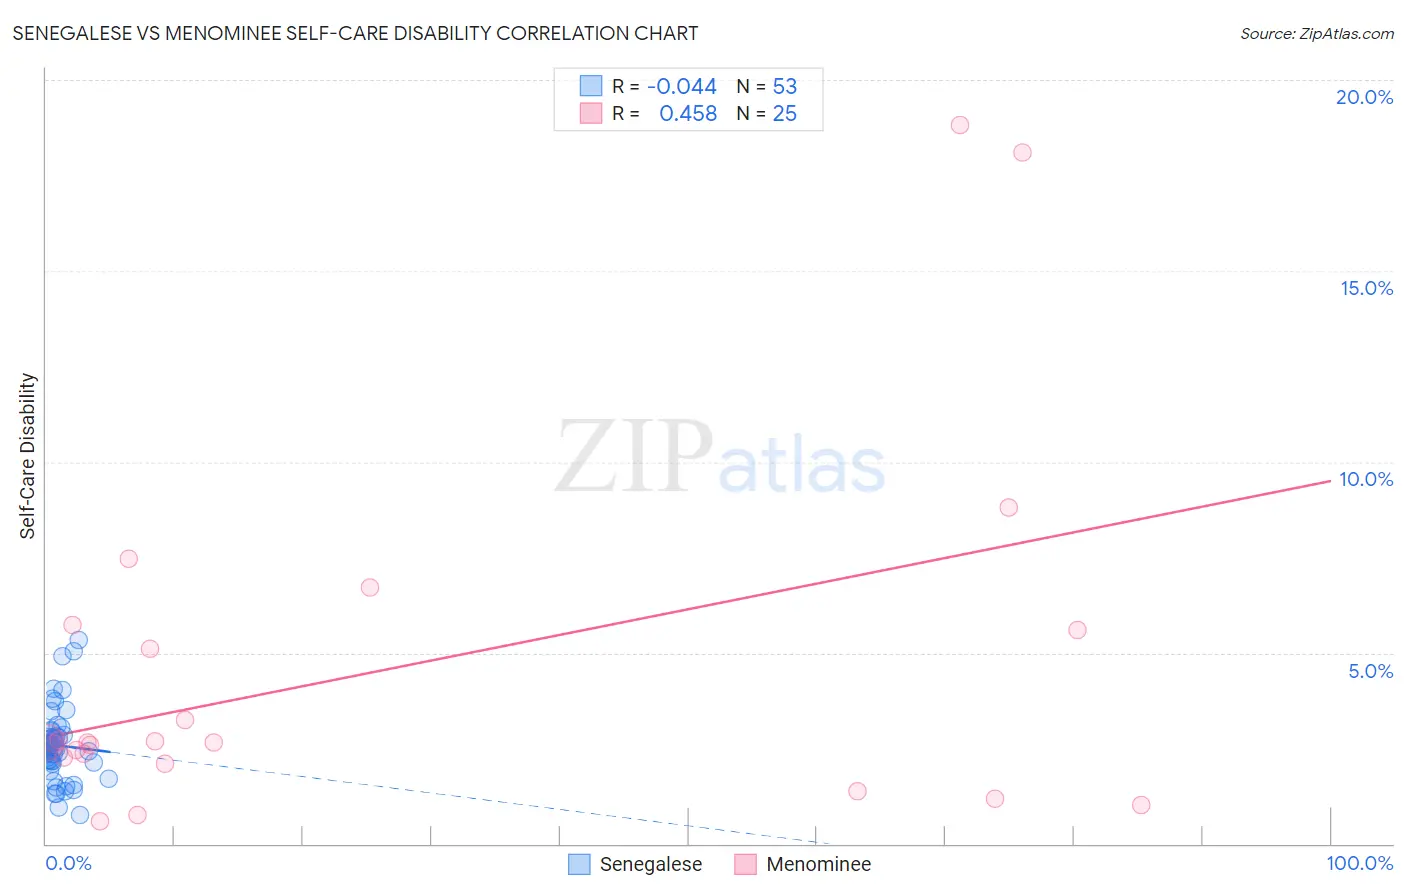
Senegalese vs Menominee Self-Care Disability Correlation Chart
The statistical analysis conducted on geographies consisting of 78,103,112 people shows no correlation between the proportion of Senegalese and percentage of population with self-care disability in the United States with a correlation coefficient (R) of -0.044 and weighted average of 2.6%. Similarly, the statistical analysis conducted on geographies consisting of 45,776,619 people shows a moderate positive correlation between the proportion of Menominee and percentage of population with self-care disability in the United States with a correlation coefficient (R) of 0.458 and weighted average of 2.8%, a difference of 9.7%.
Self-Care Disability Correlation Summary
| Measurement | Senegalese | Menominee |
| Minimum | 0.74% | 0.59% |
| Maximum | 5.3% | 18.8% |
| Range | 4.6% | 18.2% |
| Mean | 2.6% | 4.5% |
| Median | 2.5% | 2.6% |
| Interquartile 25% (IQ1) | 2.1% | 2.2% |
| Interquartile 75% (IQ3) | 2.9% | 5.7% |
| Interquartile Range (IQR) | 0.77% | 3.5% |
| Standard Deviation (Sample) | 0.96% | 4.7% |
| Standard Deviation (Population) | 0.95% | 4.6% |
Similar Demographics by Self-Care Disability
Demographics Similar to Senegalese by Self-Care Disability
In terms of self-care disability, the demographic groups most similar to Senegalese are Immigrants from Panama (2.6%, a difference of 0.040%), Marshallese (2.6%, a difference of 0.070%), Immigrants from Syria (2.6%, a difference of 0.24%), Immigrants from Senegal (2.6%, a difference of 0.26%), and Bermudan (2.6%, a difference of 0.46%).
| Demographics | Rating | Rank | Self-Care Disability |
| Immigrants | Guatemala | 2.2 /100 | #231 | Tragic 2.6% |
| Albanians | 2.2 /100 | #232 | Tragic 2.6% |
| Liberians | 2.1 /100 | #233 | Tragic 2.6% |
| Vietnamese | 2.1 /100 | #234 | Tragic 2.6% |
| Bahamians | 2.0 /100 | #235 | Tragic 2.6% |
| Bermudans | 1.9 /100 | #236 | Tragic 2.6% |
| Immigrants | Senegal | 1.6 /100 | #237 | Tragic 2.6% |
| Senegalese | 1.3 /100 | #238 | Tragic 2.6% |
| Immigrants | Panama | 1.2 /100 | #239 | Tragic 2.6% |
| Marshallese | 1.2 /100 | #240 | Tragic 2.6% |
| Immigrants | Syria | 1.0 /100 | #241 | Tragic 2.6% |
| Spanish | 0.8 /100 | #242 | Tragic 2.6% |
| Hawaiians | 0.8 /100 | #243 | Tragic 2.6% |
| Yuman | 0.8 /100 | #244 | Tragic 2.6% |
| Immigrants | Western Asia | 0.6 /100 | #245 | Tragic 2.6% |
Demographics Similar to Menominee by Self-Care Disability
In terms of self-care disability, the demographic groups most similar to Menominee are Immigrants from Cuba (2.8%, a difference of 0.10%), Immigrants from Dominica (2.8%, a difference of 0.13%), Assyrian/Chaldean/Syriac (2.8%, a difference of 0.14%), Spanish American Indian (2.9%, a difference of 0.29%), and Creek (2.8%, a difference of 0.32%).
| Demographics | Rating | Rank | Self-Care Disability |
| Bangladeshis | 0.0 /100 | #309 | Tragic 2.8% |
| British West Indians | 0.0 /100 | #310 | Tragic 2.8% |
| Puget Sound Salish | 0.0 /100 | #311 | Tragic 2.8% |
| Immigrants | Caribbean | 0.0 /100 | #312 | Tragic 2.8% |
| Spanish Americans | 0.0 /100 | #313 | Tragic 2.8% |
| Creek | 0.0 /100 | #314 | Tragic 2.8% |
| Immigrants | Cuba | 0.0 /100 | #315 | Tragic 2.8% |
| Menominee | 0.0 /100 | #316 | Tragic 2.8% |
| Immigrants | Dominica | 0.0 /100 | #317 | Tragic 2.8% |
| Assyrians/Chaldeans/Syriacs | 0.0 /100 | #318 | Tragic 2.8% |
| Spanish American Indians | 0.0 /100 | #319 | Tragic 2.9% |
| Chickasaw | 0.0 /100 | #320 | Tragic 2.9% |
| Navajo | 0.0 /100 | #321 | Tragic 2.9% |
| Comanche | 0.0 /100 | #322 | Tragic 2.9% |
| Seminole | 0.0 /100 | #323 | Tragic 2.9% |