Immigrants from Guatemala vs South American 10th Grade
COMPARE
Immigrants from Guatemala
South American
10th Grade
10th Grade Comparison
Immigrants from Guatemala
South Americans
87.4%
10TH GRADE
0.0/ 100
METRIC RATING
342nd/ 347
METRIC RANK
92.8%
10TH GRADE
0.9/ 100
METRIC RATING
252nd/ 347
METRIC RANK
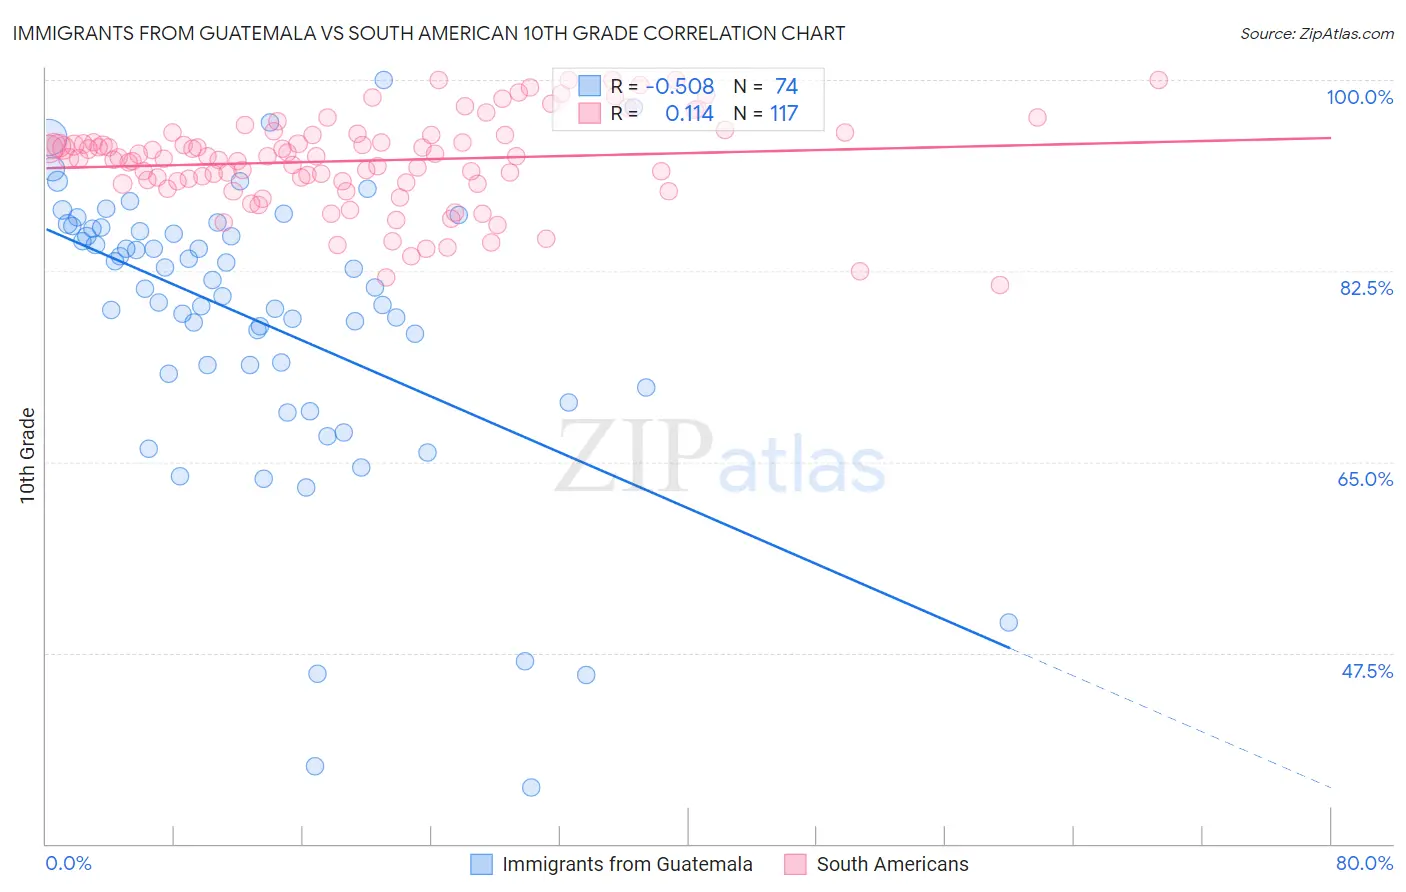
Immigrants from Guatemala vs South American 10th Grade Correlation Chart
The statistical analysis conducted on geographies consisting of 377,286,142 people shows a substantial negative correlation between the proportion of Immigrants from Guatemala and percentage of population with at least 10th grade education in the United States with a correlation coefficient (R) of -0.508 and weighted average of 87.4%. Similarly, the statistical analysis conducted on geographies consisting of 494,065,729 people shows a poor positive correlation between the proportion of South Americans and percentage of population with at least 10th grade education in the United States with a correlation coefficient (R) of 0.114 and weighted average of 92.8%, a difference of 6.1%.
10th Grade Correlation Summary
| Measurement | Immigrants from Guatemala | South American |
| Minimum | 35.2% | 81.2% |
| Maximum | 100.0% | 100.0% |
| Range | 64.8% | 18.7% |
| Mean | 77.9% | 92.6% |
| Median | 80.9% | 93.0% |
| Interquartile 25% (IQ1) | 73.1% | 90.7% |
| Interquartile 75% (IQ3) | 86.4% | 95.0% |
| Interquartile Range (IQR) | 13.3% | 4.3% |
| Standard Deviation (Sample) | 13.3% | 4.1% |
| Standard Deviation (Population) | 13.2% | 4.1% |
Similar Demographics by 10th Grade
Demographics Similar to Immigrants from Guatemala by 10th Grade
In terms of 10th grade, the demographic groups most similar to Immigrants from Guatemala are Salvadoran (87.5%, a difference of 0.16%), Mexican (87.8%, a difference of 0.44%), Yakama (86.9%, a difference of 0.58%), Guatemalan (87.9%, a difference of 0.60%), and Immigrants from El Salvador (86.8%, a difference of 0.72%).
| Demographics | Rating | Rank | 10th Grade |
| Hondurans | 0.0 /100 | #333 | Tragic 89.0% |
| Hispanics or Latinos | 0.0 /100 | #334 | Tragic 88.9% |
| Immigrants | Dominican Republic | 0.0 /100 | #335 | Tragic 88.7% |
| Immigrants | Honduras | 0.0 /100 | #336 | Tragic 88.5% |
| Central Americans | 0.0 /100 | #337 | Tragic 88.4% |
| Immigrants | Latin America | 0.0 /100 | #338 | Tragic 88.3% |
| Guatemalans | 0.0 /100 | #339 | Tragic 87.9% |
| Mexicans | 0.0 /100 | #340 | Tragic 87.8% |
| Salvadorans | 0.0 /100 | #341 | Tragic 87.5% |
| Immigrants | Guatemala | 0.0 /100 | #342 | Tragic 87.4% |
| Yakama | 0.0 /100 | #343 | Tragic 86.9% |
| Immigrants | El Salvador | 0.0 /100 | #344 | Tragic 86.8% |
| Immigrants | Central America | 0.0 /100 | #345 | Tragic 86.6% |
| Spanish American Indians | 0.0 /100 | #346 | Tragic 86.2% |
| Immigrants | Mexico | 0.0 /100 | #347 | Tragic 86.2% |
Demographics Similar to South Americans by 10th Grade
In terms of 10th grade, the demographic groups most similar to South Americans are Ghanaian (92.8%, a difference of 0.0%), Immigrants from Thailand (92.8%, a difference of 0.010%), Armenian (92.7%, a difference of 0.010%), Jamaican (92.8%, a difference of 0.060%), and Immigrants from Bolivia (92.7%, a difference of 0.060%).
| Demographics | Rating | Rank | 10th Grade |
| Uruguayans | 1.8 /100 | #245 | Tragic 92.9% |
| Immigrants | Middle Africa | 1.7 /100 | #246 | Tragic 92.9% |
| Immigrants | Afghanistan | 1.4 /100 | #247 | Tragic 92.8% |
| Colombians | 1.4 /100 | #248 | Tragic 92.8% |
| Immigrants | Senegal | 1.4 /100 | #249 | Tragic 92.8% |
| Jamaicans | 1.2 /100 | #250 | Tragic 92.8% |
| Immigrants | Thailand | 1.0 /100 | #251 | Tragic 92.8% |
| South Americans | 0.9 /100 | #252 | Tragic 92.8% |
| Ghanaians | 0.9 /100 | #253 | Tragic 92.8% |
| Armenians | 0.9 /100 | #254 | Tragic 92.7% |
| Immigrants | Bolivia | 0.7 /100 | #255 | Tragic 92.7% |
| Immigrants | Nigeria | 0.7 /100 | #256 | Tragic 92.7% |
| U.S. Virgin Islanders | 0.7 /100 | #257 | Tragic 92.7% |
| Immigrants | Costa Rica | 0.6 /100 | #258 | Tragic 92.7% |
| Immigrants | Jamaica | 0.5 /100 | #259 | Tragic 92.6% |