Immigrants from Guatemala vs Scotch-Irish Ambulatory Disability
COMPARE
Immigrants from Guatemala
Scotch-Irish
Ambulatory Disability
Ambulatory Disability Comparison
Immigrants from Guatemala
Scotch-Irish
6.2%
AMBULATORY DISABILITY
31.9/ 100
METRIC RATING
191st/ 347
METRIC RANK
6.9%
AMBULATORY DISABILITY
0.0/ 100
METRIC RATING
290th/ 347
METRIC RANK
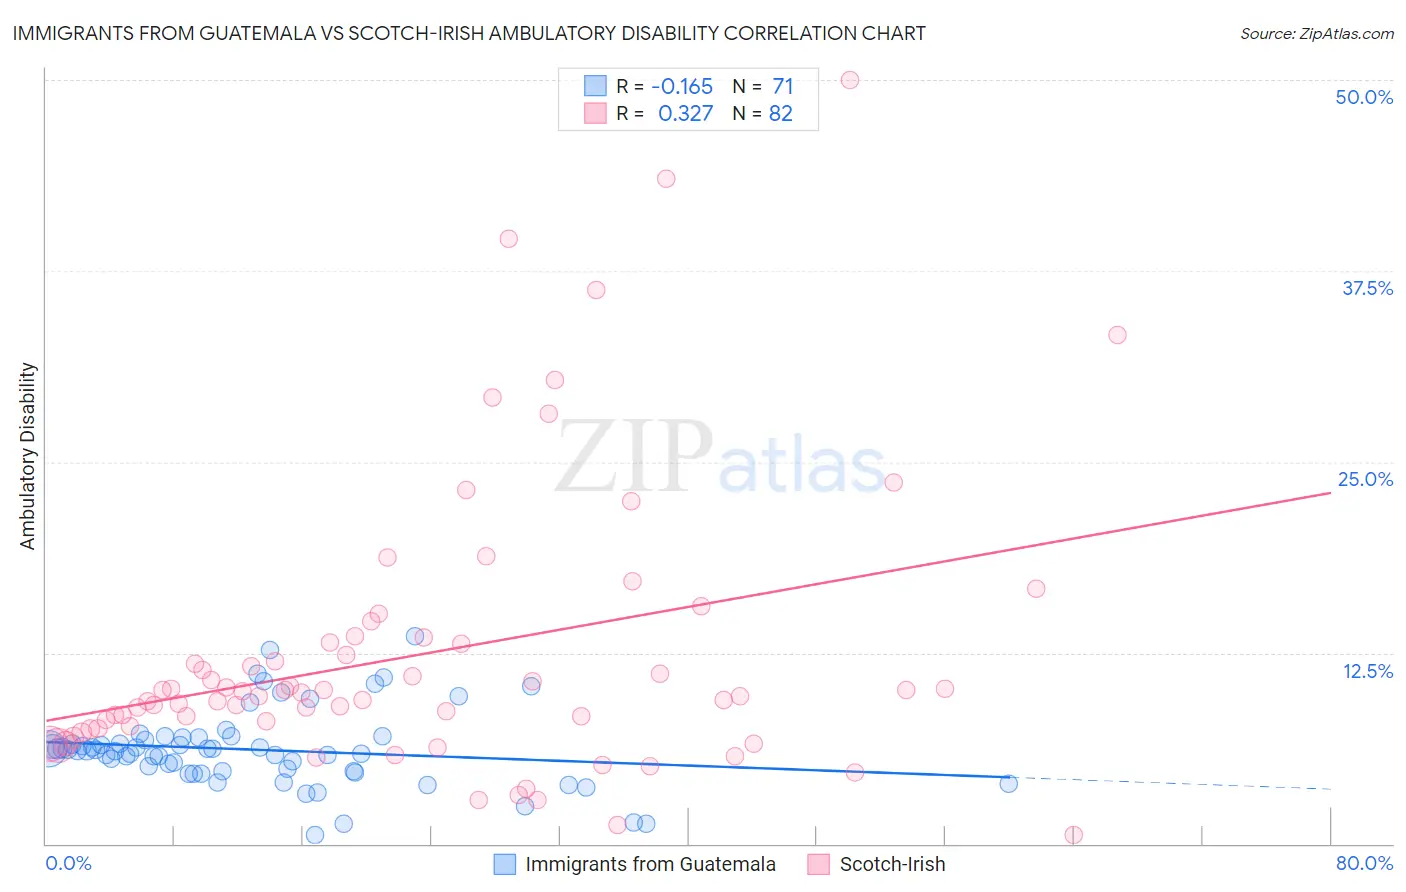
Immigrants from Guatemala vs Scotch-Irish Ambulatory Disability Correlation Chart
The statistical analysis conducted on geographies consisting of 377,192,086 people shows a poor negative correlation between the proportion of Immigrants from Guatemala and percentage of population with ambulatory disability in the United States with a correlation coefficient (R) of -0.165 and weighted average of 6.2%. Similarly, the statistical analysis conducted on geographies consisting of 548,439,452 people shows a mild positive correlation between the proportion of Scotch-Irish and percentage of population with ambulatory disability in the United States with a correlation coefficient (R) of 0.327 and weighted average of 6.9%, a difference of 11.1%.
Ambulatory Disability Correlation Summary
| Measurement | Immigrants from Guatemala | Scotch-Irish |
| Minimum | 0.59% | 0.57% |
| Maximum | 13.5% | 50.0% |
| Range | 13.0% | 49.4% |
| Mean | 6.2% | 12.4% |
| Median | 6.1% | 9.8% |
| Interquartile 25% (IQ1) | 4.7% | 7.5% |
| Interquartile 75% (IQ3) | 7.0% | 13.2% |
| Interquartile Range (IQR) | 2.2% | 5.6% |
| Standard Deviation (Sample) | 2.5% | 9.3% |
| Standard Deviation (Population) | 2.5% | 9.2% |
Similar Demographics by Ambulatory Disability
Demographics Similar to Immigrants from Guatemala by Ambulatory Disability
In terms of ambulatory disability, the demographic groups most similar to Immigrants from Guatemala are Immigrants from Western Europe (6.2%, a difference of 0.020%), Immigrants from Western Africa (6.2%, a difference of 0.090%), Ukrainian (6.2%, a difference of 0.12%), Guatemalan (6.2%, a difference of 0.12%), and Alaska Native (6.2%, a difference of 0.13%).
| Demographics | Rating | Rank | Ambulatory Disability |
| Immigrants | Ghana | 41.2 /100 | #184 | Average 6.1% |
| Immigrants | Bosnia and Herzegovina | 37.2 /100 | #185 | Fair 6.2% |
| Europeans | 36.2 /100 | #186 | Fair 6.2% |
| Carpatho Rusyns | 35.3 /100 | #187 | Fair 6.2% |
| British | 34.3 /100 | #188 | Fair 6.2% |
| Ukrainians | 34.0 /100 | #189 | Fair 6.2% |
| Immigrants | Western Africa | 33.4 /100 | #190 | Fair 6.2% |
| Immigrants | Guatemala | 31.9 /100 | #191 | Fair 6.2% |
| Immigrants | Western Europe | 31.6 /100 | #192 | Fair 6.2% |
| Guatemalans | 30.0 /100 | #193 | Fair 6.2% |
| Alaska Natives | 29.8 /100 | #194 | Fair 6.2% |
| Belgians | 28.6 /100 | #195 | Fair 6.2% |
| Malaysians | 28.2 /100 | #196 | Fair 6.2% |
| Poles | 26.3 /100 | #197 | Fair 6.2% |
| Immigrants | Bangladesh | 24.6 /100 | #198 | Fair 6.2% |
Demographics Similar to Scotch-Irish by Ambulatory Disability
In terms of ambulatory disability, the demographic groups most similar to Scotch-Irish are Immigrants from Dominica (6.9%, a difference of 0.030%), West Indian (6.9%, a difference of 0.10%), Cheyenne (6.9%, a difference of 0.16%), Nonimmigrants (6.9%, a difference of 0.17%), and Immigrants from St. Vincent and the Grenadines (6.9%, a difference of 0.40%).
| Demographics | Rating | Rank | Ambulatory Disability |
| Immigrants | Barbados | 0.0 /100 | #283 | Tragic 6.8% |
| Immigrants | Jamaica | 0.0 /100 | #284 | Tragic 6.8% |
| Fijians | 0.0 /100 | #285 | Tragic 6.8% |
| Yakama | 0.0 /100 | #286 | Tragic 6.8% |
| U.S. Virgin Islanders | 0.0 /100 | #287 | Tragic 6.8% |
| Immigrants | Nonimmigrants | 0.0 /100 | #288 | Tragic 6.9% |
| Immigrants | Dominica | 0.0 /100 | #289 | Tragic 6.9% |
| Scotch-Irish | 0.0 /100 | #290 | Tragic 6.9% |
| West Indians | 0.0 /100 | #291 | Tragic 6.9% |
| Cheyenne | 0.0 /100 | #292 | Tragic 6.9% |
| Immigrants | St. Vincent and the Grenadines | 0.0 /100 | #293 | Tragic 6.9% |
| Cape Verdeans | 0.0 /100 | #294 | Tragic 6.9% |
| Crow | 0.0 /100 | #295 | Tragic 6.9% |
| Alaskan Athabascans | 0.0 /100 | #296 | Tragic 6.9% |
| French American Indians | 0.0 /100 | #297 | Tragic 6.9% |