Immigrants from Grenada vs Immigrants from Egypt Disability
COMPARE
Immigrants from Grenada
Immigrants from Egypt
Disability
Disability Comparison
Immigrants from Grenada
Immigrants from Egypt
11.5%
DISABILITY
86.1/ 100
METRIC RATING
141st/ 347
METRIC RANK
10.6%
DISABILITY
100.0/ 100
METRIC RATING
31st/ 347
METRIC RANK
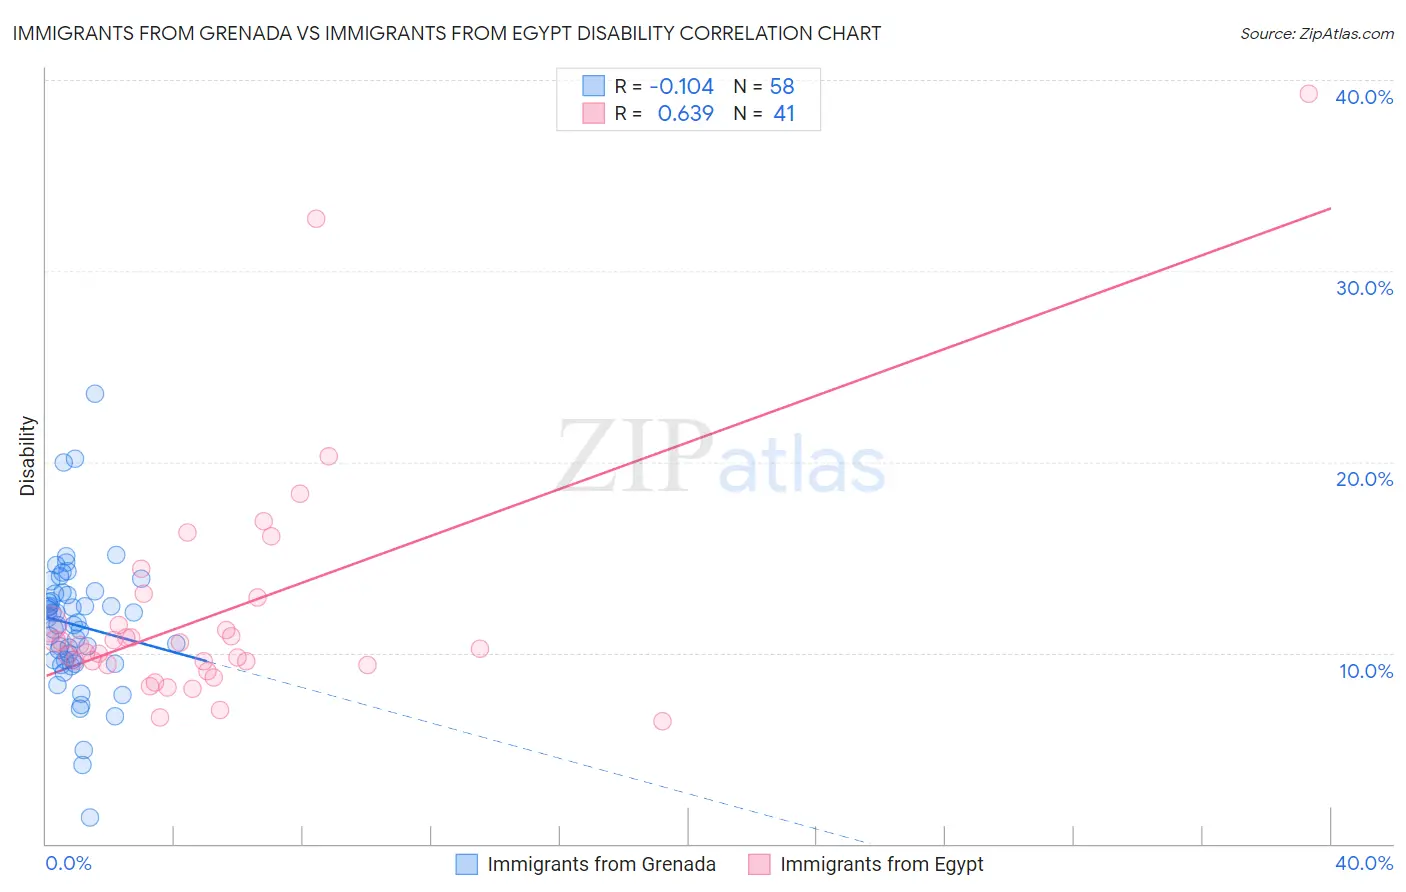
Immigrants from Grenada vs Immigrants from Egypt Disability Correlation Chart
The statistical analysis conducted on geographies consisting of 67,198,924 people shows a poor negative correlation between the proportion of Immigrants from Grenada and percentage of population with a disability in the United States with a correlation coefficient (R) of -0.104 and weighted average of 11.5%. Similarly, the statistical analysis conducted on geographies consisting of 245,492,432 people shows a significant positive correlation between the proportion of Immigrants from Egypt and percentage of population with a disability in the United States with a correlation coefficient (R) of 0.639 and weighted average of 10.6%, a difference of 7.7%.
Disability Correlation Summary
| Measurement | Immigrants from Grenada | Immigrants from Egypt |
| Minimum | 1.4% | 6.4% |
| Maximum | 23.5% | 39.3% |
| Range | 22.2% | 32.9% |
| Mean | 11.5% | 12.1% |
| Median | 11.5% | 10.4% |
| Interquartile 25% (IQ1) | 9.6% | 9.4% |
| Interquartile 75% (IQ3) | 13.1% | 12.2% |
| Interquartile Range (IQR) | 3.5% | 2.8% |
| Standard Deviation (Sample) | 3.6% | 6.3% |
| Standard Deviation (Population) | 3.6% | 6.2% |
Similar Demographics by Disability
Demographics Similar to Immigrants from Grenada by Disability
In terms of disability, the demographic groups most similar to Immigrants from Grenada are Russian (11.5%, a difference of 0.070%), Immigrants from Sudan (11.5%, a difference of 0.070%), Ghanaian (11.5%, a difference of 0.080%), New Zealander (11.5%, a difference of 0.090%), and Kenyan (11.5%, a difference of 0.10%).
| Demographics | Rating | Rank | Disability |
| Immigrants | Guyana | 88.3 /100 | #134 | Excellent 11.4% |
| Ugandans | 87.9 /100 | #135 | Excellent 11.4% |
| Immigrants | St. Vincent and the Grenadines | 87.8 /100 | #136 | Excellent 11.4% |
| Kenyans | 87.1 /100 | #137 | Excellent 11.5% |
| New Zealanders | 87.0 /100 | #138 | Excellent 11.5% |
| Ghanaians | 87.0 /100 | #139 | Excellent 11.5% |
| Russians | 86.8 /100 | #140 | Excellent 11.5% |
| Immigrants | Grenada | 86.1 /100 | #141 | Excellent 11.5% |
| Immigrants | Sudan | 85.3 /100 | #142 | Excellent 11.5% |
| Moroccans | 83.3 /100 | #143 | Excellent 11.5% |
| Australians | 82.5 /100 | #144 | Excellent 11.5% |
| Nigerians | 81.3 /100 | #145 | Excellent 11.5% |
| Immigrants | Hungary | 79.0 /100 | #146 | Good 11.5% |
| Immigrants | Ukraine | 77.6 /100 | #147 | Good 11.5% |
| Sudanese | 77.1 /100 | #148 | Good 11.5% |
Demographics Similar to Immigrants from Egypt by Disability
In terms of disability, the demographic groups most similar to Immigrants from Egypt are Immigrants from Turkey (10.6%, a difference of 0.070%), Paraguayan (10.6%, a difference of 0.10%), Immigrants from Argentina (10.6%, a difference of 0.23%), Egyptian (10.6%, a difference of 0.35%), and Immigrants from Kuwait (10.7%, a difference of 0.35%).
| Demographics | Rating | Rank | Disability |
| Venezuelans | 100.0 /100 | #24 | Exceptional 10.5% |
| Immigrants | Malaysia | 100.0 /100 | #25 | Exceptional 10.6% |
| Argentineans | 100.0 /100 | #26 | Exceptional 10.6% |
| Cypriots | 100.0 /100 | #27 | Exceptional 10.6% |
| Egyptians | 100.0 /100 | #28 | Exceptional 10.6% |
| Immigrants | Argentina | 100.0 /100 | #29 | Exceptional 10.6% |
| Immigrants | Turkey | 100.0 /100 | #30 | Exceptional 10.6% |
| Immigrants | Egypt | 100.0 /100 | #31 | Exceptional 10.6% |
| Paraguayans | 100.0 /100 | #32 | Exceptional 10.6% |
| Immigrants | Kuwait | 100.0 /100 | #33 | Exceptional 10.7% |
| Immigrants | Ethiopia | 100.0 /100 | #34 | Exceptional 10.7% |
| Immigrants | Indonesia | 100.0 /100 | #35 | Exceptional 10.7% |
| Ethiopians | 100.0 /100 | #36 | Exceptional 10.7% |
| Turks | 100.0 /100 | #37 | Exceptional 10.7% |
| Afghans | 99.9 /100 | #38 | Exceptional 10.8% |