Immigrants from Grenada vs Immigrants from Haiti Disability
COMPARE
Immigrants from Grenada
Immigrants from Haiti
Disability
Disability Comparison
Immigrants from Grenada
Immigrants from Haiti
11.5%
DISABILITY
86.1/ 100
METRIC RATING
141st/ 347
METRIC RANK
11.7%
DISABILITY
59.2/ 100
METRIC RATING
162nd/ 347
METRIC RANK
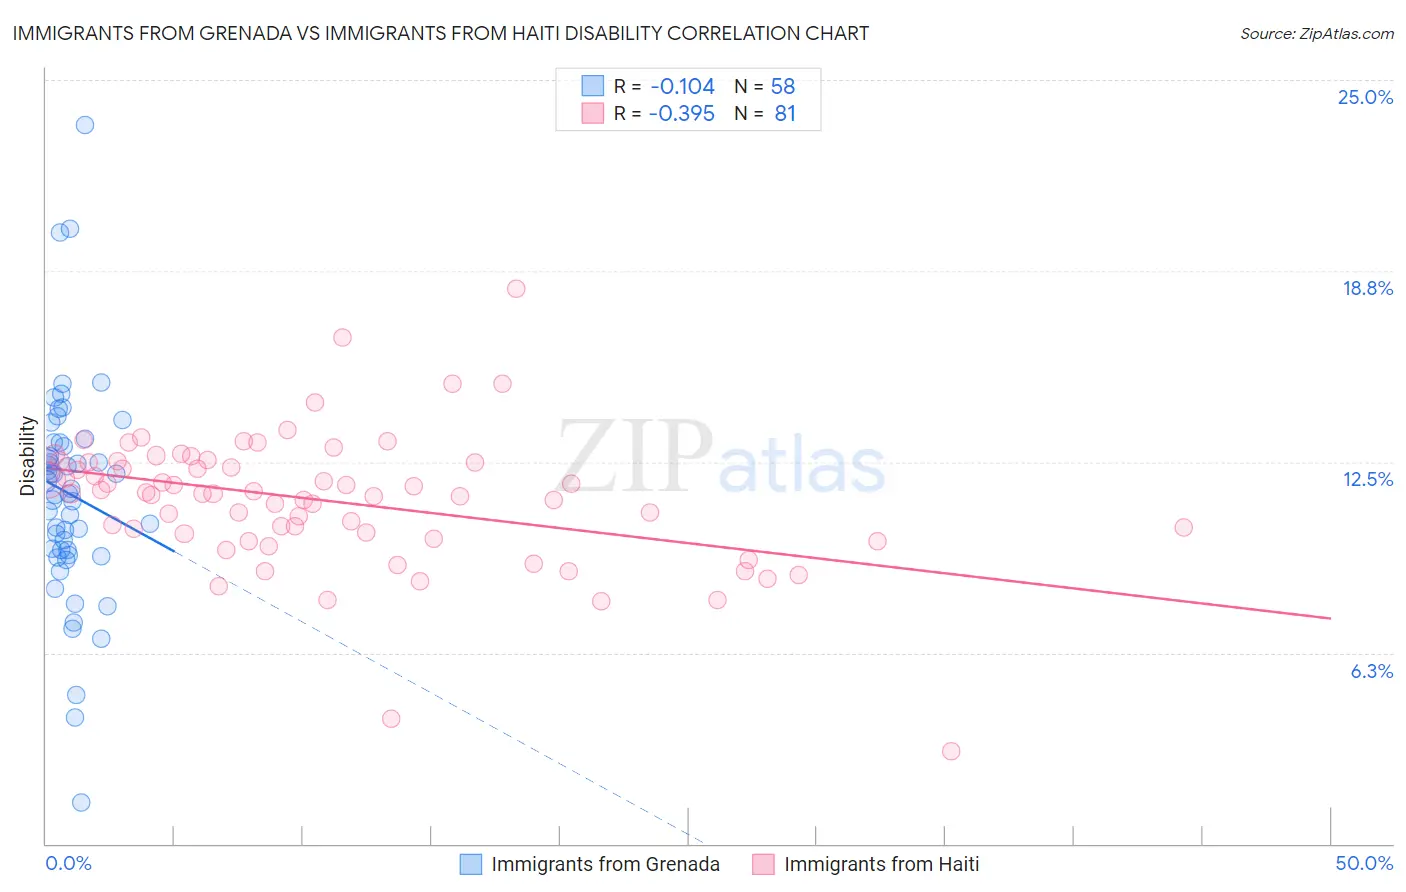
Immigrants from Grenada vs Immigrants from Haiti Disability Correlation Chart
The statistical analysis conducted on geographies consisting of 67,198,924 people shows a poor negative correlation between the proportion of Immigrants from Grenada and percentage of population with a disability in the United States with a correlation coefficient (R) of -0.104 and weighted average of 11.5%. Similarly, the statistical analysis conducted on geographies consisting of 225,241,384 people shows a mild negative correlation between the proportion of Immigrants from Haiti and percentage of population with a disability in the United States with a correlation coefficient (R) of -0.395 and weighted average of 11.7%, a difference of 1.6%.
Disability Correlation Summary
| Measurement | Immigrants from Grenada | Immigrants from Haiti |
| Minimum | 1.4% | 3.0% |
| Maximum | 23.5% | 18.2% |
| Range | 22.2% | 15.2% |
| Mean | 11.5% | 11.2% |
| Median | 11.5% | 11.5% |
| Interquartile 25% (IQ1) | 9.6% | 10.1% |
| Interquartile 75% (IQ3) | 13.1% | 12.5% |
| Interquartile Range (IQR) | 3.5% | 2.4% |
| Standard Deviation (Sample) | 3.6% | 2.2% |
| Standard Deviation (Population) | 3.6% | 2.2% |
Similar Demographics by Disability
Demographics Similar to Immigrants from Grenada by Disability
In terms of disability, the demographic groups most similar to Immigrants from Grenada are Russian (11.5%, a difference of 0.070%), Immigrants from Sudan (11.5%, a difference of 0.070%), Ghanaian (11.5%, a difference of 0.080%), New Zealander (11.5%, a difference of 0.090%), and Kenyan (11.5%, a difference of 0.10%).
| Demographics | Rating | Rank | Disability |
| Immigrants | Guyana | 88.3 /100 | #134 | Excellent 11.4% |
| Ugandans | 87.9 /100 | #135 | Excellent 11.4% |
| Immigrants | St. Vincent and the Grenadines | 87.8 /100 | #136 | Excellent 11.4% |
| Kenyans | 87.1 /100 | #137 | Excellent 11.5% |
| New Zealanders | 87.0 /100 | #138 | Excellent 11.5% |
| Ghanaians | 87.0 /100 | #139 | Excellent 11.5% |
| Russians | 86.8 /100 | #140 | Excellent 11.5% |
| Immigrants | Grenada | 86.1 /100 | #141 | Excellent 11.5% |
| Immigrants | Sudan | 85.3 /100 | #142 | Excellent 11.5% |
| Moroccans | 83.3 /100 | #143 | Excellent 11.5% |
| Australians | 82.5 /100 | #144 | Excellent 11.5% |
| Nigerians | 81.3 /100 | #145 | Excellent 11.5% |
| Immigrants | Hungary | 79.0 /100 | #146 | Good 11.5% |
| Immigrants | Ukraine | 77.6 /100 | #147 | Good 11.5% |
| Sudanese | 77.1 /100 | #148 | Good 11.5% |
Demographics Similar to Immigrants from Haiti by Disability
In terms of disability, the demographic groups most similar to Immigrants from Haiti are Immigrants from Trinidad and Tobago (11.7%, a difference of 0.020%), Syrian (11.7%, a difference of 0.030%), Cuban (11.7%, a difference of 0.12%), Immigrants from Cuba (11.6%, a difference of 0.17%), and Pakistani (11.7%, a difference of 0.21%).
| Demographics | Rating | Rank | Disability |
| Immigrants | Netherlands | 69.8 /100 | #155 | Good 11.6% |
| Immigrants | Fiji | 69.5 /100 | #156 | Good 11.6% |
| Immigrants | Middle Africa | 69.5 /100 | #157 | Good 11.6% |
| Armenians | 65.9 /100 | #158 | Good 11.6% |
| Guatemalans | 65.1 /100 | #159 | Good 11.6% |
| Immigrants | Barbados | 64.2 /100 | #160 | Good 11.6% |
| Immigrants | Cuba | 62.8 /100 | #161 | Good 11.6% |
| Immigrants | Haiti | 59.2 /100 | #162 | Average 11.7% |
| Immigrants | Trinidad and Tobago | 58.9 /100 | #163 | Average 11.7% |
| Syrians | 58.5 /100 | #164 | Average 11.7% |
| Cubans | 56.7 /100 | #165 | Average 11.7% |
| Pakistanis | 54.7 /100 | #166 | Average 11.7% |
| Estonians | 54.4 /100 | #167 | Average 11.7% |
| Immigrants | Latin America | 54.1 /100 | #168 | Average 11.7% |
| Immigrants | Austria | 53.4 /100 | #169 | Average 11.7% |